

MHSAA Ups Awareness with 'Heat Ways'
August 6, 2013
With the beginning of a new year for high school sports just a week away, members of the Michigan High School Athletic Association have been preparing to follow a new model policy for hot weather activity, guided by a new publication and a rules meeting emphasis on heat and hydration.
The MHSAA Representative Council adopted a Model Policy for Managing Heat & Humidity earlier this year, a plan many schools have since adopted at the local level. The plan directs schools to begin monitoring the heat index at the activity site once the air temperature reaches 80 degrees, and provides recommendations when the heat index reaches certain points, including ceasing activities when it rises above 104 degrees.
The model policy is outlined in a number of places, including a new publication called Heat Ways, which is available for download from the MHSAA Website. Heat Ways not only provides the model policy, but addresses the need for proper acclimatization in hot weather.
The topic of heat-related injuries receives a lot of attention at this time of year, especially when deaths at the professional, collegiate and interscholastic levels of sport occur, and especially since they are preventable in most cases with the proper precautions. In football, data from the National Federation of State High School Associations shows that 41 high school players have died from heat stroke between 1995 and 2012.
Even before the days of the Internet, the MHSAA held a leadership role in providing resources each Spring to assist schools in their preparation for hot preseason practices. In addition to the information now contained in Heat Ways, the Association is making dealing with heat, hydration and acclimatization the topic for its required preseason rules meetings for coaches and officials. The 15-minute online presentation spends a fair amount of time talking about the need for good hydration in sports, regardless of the activity or time of year.
The Health & Safety Resources page of the MHSAA Website has a set a number of links to different publications and information, and a free online presentation from the National Federation of State High School Associations. Visit MHSAA.com, click on Schools, and then on Health & Safety Resources to find the information.
“We know now more than we ever have about when the risk is high and who is most at risk, and we’re fortunate to be able to communicate that information better than ever before to administrators, coaches, athletes and parents," said John E. “Jack” Roberts, executive director of the MHSAA. “Heat stroke is almost always preventable, and we encourage everyone to avail themselves of the information on our website.”
Roberts added that the first days of formal practices in hot weather should be more for heat acclimatization than the conditioning of athletes, and that practices in such conditions need planning to become longer and more strenuous over a gradual progression of time.
“Then, schools need to be vigilant about providing water during practices, making sure that youngsters are partaking of water and educating their teams about the need for good hydration practices away from the practice and competition fields,” Roberts said.
Scholars & Athletes 2019: Class C & D
By
Geoff Kimmerly
MHSAA.com senior editor
February 4, 2019
By Geoff Kimmerly
Second Half editor
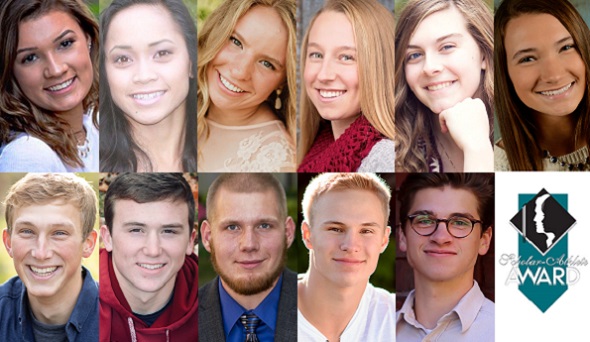
The Michigan High School Athletic Association has selected 11 student-athletes from Class C and D member schools to receive scholarships through the MHSAA/Farm Bureau Insurance Scholar-Athlete Award program.
 Farm Bureau Insurance, in its 30th year of sponsoring the award, will give $1,000 college scholarships to 32 individuals who represent their member schools in at least one sport in which the Association sponsors a postseason tournament. The first 30 scholarships are awarded proportionately by school classification and the number of student-athletes involved in those classes; also, there are two at-large honorees who can come from any classification.
Students applying for the Scholar-Athlete Award must be carrying at least a 3.5 (on a 4.0 scale) grade-point average and have previously won a letter in a varsity sport in which the Michigan High School Athletic Association sponsors a postseason tournament. Other requirements for the applicants were to show active participation in other school and community activities and produce an essay on the importance of sportsmanship in educational athletics.
Each of the scholarship recipients will be honored at a halftime ceremony during the Class C Boys Basketball Final, March 16, at the Breslin Student Events Center in East Lansing. Commemorative medallions will be given to the finalists in recognition of their accomplishments.
The Class C Scholar-Athlete Award honorees are: Rachel Allen, Mason County Central; Precious Delos Santos, Indian River Inland Lakes; Lauren Freeland, Kent City; Riley Poupore, Iron Mountain; Trey Feldeisen, Ann Arbor Greenhills; Dane Smitz, Roscommon; and Alexander VanDeWeghe, Ithaca.
The Class D Scholar-Athlete Award recipients are: Abbey Bullis, Peck; Samantha Somers, Mackinaw City; Brendan LeClaire, Dollar Bay; and Ryan Yahner, McBain Northern Michigan Christian.
Overviews of the scholarship recipients of the Class C Scholar-Athlete Award follow. A quote from each recipient's essay also is included:
 Rachel Allen, Mason County Central
Playing fourth season of varsity basketball, ran four seasons of varsity cross country and will run her fourth of track & field this spring. Earned all-state recognition in basketball and track and all-league in cross country, in addition to academic all-state or all-league honors in all three sports. Served as basketball captain three years and helped team to District title in 2018. Participating in fourth year of National Honor Society and served as class and student council vice president both for three years. Earned MCC’s HG Bacon Award for high academic success through all three trimesters her first three years of high school and was invited to leadership summit at Grand Valley State University as a junior. Has participated in a number of volunteer service projects throughout high school and this year is taking part in in-the-field clinical rotations as part of Allied Health Technology course. Will attend Calvin College and study speech/language pathology.
Essay Quote: “Sportsmanship is frequently thought to be how you present yourself outwardly on the court or the field. I believe sportsmanship is much more. It is the person who puts the team first, yet constantly strives to better themselves. Sportsmanship truly shines in the person you are behind the scenes.”
 Precious Delos Santos, Indian River Inland Lakes
Playing fourth season of varsity basketball, ran four seasons of varsity cross country and will play her fourth season of varsity softball and run fourth of track & field this spring. Earned all-league honors in cross country, track and softball. Started for MHSAA Finals Division 4 champion softball team in 2017 and runner-up in 2016, helped cross country teams advance to MHSAA Finals twice and served as captain of basketball and softball teams. Participating in fourth year of student council and has served as president, and participated in three years of band including as drum major. Participating in second year of National Honor Society and robotics and serves as a peer tutoring mentor. Will attend Saginaw Valley State University and study neuroscience.
Essay Quote: “I believe sportsmanship is more than just lifting an opponent from the ground or giving respect when the opponent becomes injured – or maybe even respecting the game and being willing to shake the opposing teams’ hands after. … In (my) case, I believed helping another person gave me a greater feeling that finishing the race. I felt (that) if I was in the same situation as the girl (I helped), she would’ve done the same for me.”
 Lauren Freeland, Kent City
Playing fourth season of varsity basketball, ran four seasons of varsity cross country and will run her fourth of track & field this spring. Earned all-state all four years of cross country and five times in track, and earned individual league and Regional championships in both. Helped all three teams to league championships and basketball team to Regional title in 2018 and District title in 2016. Served as captain in basketball and cross country and holds school records in cross country and track. Earned academic all-state honors in cross country and track. Participating in third year of National Honor Society and has assisted in a number of youth athletics activities as a coach, administrator and official; also served as a teacher’s assistant in summer reading program. Participating in fourth year of youth group. Will attend Michigan State University and study business.
Essay Quote: “The most amazing thing about high school sports are the friendships you can make and the impact you can have on someone else. There are very few other places in life (where) you can have a strong bond with someone through pain. … How true it is that we all, as runners, are able to come together as friends because we understand the work one another has put in.”
 Riley Poupore, Iron Mountain
Playing fourth year of varsity basketball and will play her fourth of varsity soccer and run her second of track & field this spring; also played two seasons of varsity volleyball. Served as team captain of volleyball, basketball and soccer teams multiple seasons and earned all-league honors in basketball and soccer. Ran on MHSAA Finals championship track relay team and owns school and league records for single-season soccer goals. Participating in second year of Iron Mountain Honor Society and fourth on Iron Mountain/Kingsford Youth Advisory Committee, and serving as president of latter this school year. Also participating in fourth years of key club and varsity club (as president of both) and served two years as student council representative. Served as group or team building leader for North Dickinson Schools Leadership Conference for two years and as youth leader for youth summit conference for three years. Will attend Central Michigan University and study pre-medicine.
Essay Quote: “How could a player from the other team, a team that my team was trying to beat, say something so kind, so moving, in such a tense situation? How could this girl from the other team know what I needed at that moment? … That small gesture has instilled in me the true definition of sportsmanship.”
 Trey Feldeisen, Ann Arbor Greenhills
Played four seasons of varsity tennis and will play his fourth of varsity lacrosse this spring. Served as captain of both teams. Earned two MHSAA Finals individual flight championships and contributed to two team tennis championships and two runner-up finishes. Earned all-state recognition in both tennis and lacrosse. Participating in fourth year of forensics and has helped team to two state championships and one runner-up finish. Earned multiple letters for service from the United Way of Washtenaw County and participated in medical service trips to Peru, Haiti and Kenya. Participating in third year of Model United Nations club and as secretary of training, and participating on inaugural leadership committee for school’s STEM society. Serving as youth representative to church’s staff-parish committee and as a cabinet member on Regional Youth Council. Participated in brain cancer research through University of Michigan. Will attend Washington University in Missouri and is still considering what he will study.
Essay Quote: “There are many opponents we face who have not played tennis since they were in preschool, and who (do) not have the skill that we as a team do. These matches are the ones that are most important to us and our coaches. We always push ourselves to win the ‘right’ way. This first and foremost means to show our opponents respect on and off the court.”
 Dane Smitz, Roscommon
Playing third season of varsity basketball and played three of varsity football; will play fourth of varsity baseball this spring. Earned all-league honors in all three sports and all-state in football, and helped baseball team to District championships as a sophomore and junior. Served as captain of all three teams. Participating in second year of National Honor Society and as chapter vice president, and serving third year on Youth Advisory Council. Participating in fourth year of quiz bowl and this year as captain, and also participating in second year of interact club and fourth with church youth group. Earned a number of school academic honors and honorable mention for wood shop from Michigan Industrial Technology Education Society. Served as student leader of autism awareness group. Will attend Aquinas College and study pre-dental.
Essay Quote: “Always looking up to the older kids, I dreamed about being as good as they were at sports and representing their families as well as our community. As a captain, I know that even more focus is put on me as a student-athlete in our community. Whether it be handing over the ball to a referee after a touchdown or holding a door open for an elderly couple at a restaurant, small acts like these are what dictate the way future students and athletes will act at my school.”
 Alexander VanDeWeghe, Ithaca
Will run his fourth season of varsity track & field this spring, and is a two-time all-stater and three-time MHSAA Finals qualifier. Served as team captain as a junior. Serving second year as student council president, fourth as Model United Nations team captain and third as quiz bowl team captain, and also as an executive board member for National Honor Society in his second year participating in the chapter. Earned all-league honors for quiz bowl and Model UN and recognition for the latter at competitions in Washington, D.C., and Indianapolis. Named Michigan Council for the Social Studies “Student of the Year.” Playing second year in school jazz band and played three as part of marching band. Participating in church youth group for fourth year. Will attend University of Michigan and study environmental engineering.
Essay Quote: “Every action I take during a competition, or even practice, is being observed and absorbed by those around, especially younger children who are easily impacted. Ultimately, the sphere of influence as an athlete is often significantly larger than we realize, and it is vital to be conscious of our actions in sports to ensure that the impact we leave on those around us is a positive one.”
Other Class C girls finalists for the Scholar-Athlete Award were: Sarah Barnes, Houghton Lake; Megan Dopheide, Lawton; Elizabeth O'Hotzke, Manchester; Joslyn Muth, Manistique; Jordan Cooper, Saranac; Thea Johnson, Saugatuck; Lillian Bambacht, Union City; and Jordan Craven, Whitmore Lake.
Other Class C boys finalists for the Scholar-Athlete Award were: Brian Goetz, Blissfield; Timothy Marvin, Byron; Noah Waldron, Concord; Jared Swiontek, East Jackson; Jack Sumners, Marcellus; Logan Marshall, Marlette; Logan Solgat, Marlette; Drew Ward, Saranac; and Nathan Huizar, Vassar.
Overviews of the scholarship recipients of the Class D Scholar-Athlete Award follow. A quote from each recipient's essay also is included:
 Abbey Bullis, Peck
Playing her third season of varsity basketball and finished her second of varsity volleyball in the fall; will play her fourth of varsity softball this spring. Earned all-league honors in all three and helped basketball and softball teams to league titles. Served as captain of all three teams at least two seasons. Will graduate having completed nine college classes through dual enrollment and is participating in her third year of National Honor Society. Participating in fourth years on math academic games and quiz bowl teams and serving her fourth as her class vice president and as part of Sanilac County Youth Advisory Council. Participates in various volunteer efforts and earned President’s Gold Volunteer Service Award. Graduated from Hugh O’Brian (HOBY) leadership program and earned HOBY Leadership Certificate of Recognition. Will attend Oakland University and study mathematics.
Essay Quote: “I try to be a positive role model for the underclassmen at my school. When they are watching in the stands, I would like them to understand that sports are important, but how you carry yourself and treat others on the court is just as important. … Someone told me that people know me for my athletic ability and accomplishments, but that people remember me for the way I play the game and my positive attitude – win or lose. If this is true, I feel this is the best compliment I could be given.”
 Samantha Somers, Mackinaw City
Playing third season of varsity basketball and ran her fourth of varsity cross country in the fall; will play her fourth of varsity softball this spring. Earned all-conference honors in all three sports and academic all-league in basketball and cross country. Served as captain of all three teams. Participating in second year of National Honor Society and as president, and has served as class president all four years of high school. Also serving third year on Straits Area Youth Advisory Council. Plays in concert and jazz bands and earned multiple high ratings, and earned multiple placings as part of Science Olympiad team. Participates in yearbook and Random Acts of Kindness Club. Will attend Wayne State University and study health science.
Essay Quote: “Educational athletics has taught me to be kind to others for no other reason than to be kind. For example, you do not have to high five other runners at the end of a race or help an opponent up when they fall in basketball, but you do it without thinking of a reward for doing it. You could say it is “the right thing to do,” which is said a lot – and although it is true, this explanation is not meaningful. I enjoy being courteous towards teammates and opponents alike because it spreads positivity even in the heat of competition.”
 Brendan LeClaire, Dollar Bay
Playing third season of varsity basketball and played three of varsity football, and will run his fourth of track & field and play his third of varsity golf in the spring. Also ran varsity cross country as a freshman and sophomore. Earned all-league honors in football and all-state in cross country, and served as team captain in basketball, football and track. Owns four school track records and is team’s all-time leading point scorer; also holds school record in cross country and helped basketball team to Class D Semifinals in 2018. Serving fourth year as class president and on Student Leadership Committee, and participating in second year of National Honor Society, serving as president of SLC and NHS chapter as well. Earned first place in woodworking from Michigan Industrial Technology Education Society. Will attend Michigan Technological University and study engineering.
Essay Quote: “I attend a school in a small community in the Upper Peninsula of Michigan. As a student athlete in this setting, sportsmanship plays an important role, not only on the court or field, but also in the community. Our community is so small, I have had to compete against friends and relatives, at times. Always focusing on being a good opponent has guaranteed those friendships and family ties remain strong. How I’ve had to interact with people on the court has taught me to be the best person I can be in my community.”
 Ryan Yahner, McBain Northern Michigan Christian
Played four seasons of varsity soccer and will run his fourth of track & field this spring. Earned all-conference honors in both sports and served as captain of both teams; helped soccer team to District title this past fall. Participating in fourth years on student council and as part of school’s praise team, and second of National Honor Society – and serving as president of all three this school year. Also participating in fourth years of band/choir and high school musical, and earned a first-place regional finish in forensics as well as various pins for musical performances. Will attend Grand Valley State University to study general education, with the aspiration to then attend a seminary.
Essay Quote: “Now more than ever, young people need to hear that they are valuable and vital to their community, and educational athletics are a fantastic means to do so. Young people should be able to count on educational athletics to be a safe place; this is a huge part of sportsmanship. … Sportsmanship is important to educational athletics because it helps maintain a healthy and positive playing environment, and it creates a safe place for young athletes to grow and see their value through each other’s play.”
Other Class D girls finalists for the Scholar-Athlete Award were: Keagan Fischer, Bellaire; Lyndsi Wolfe, Fulton; Natalie Woodland, Lansing Christian; Scout Nelson, Mount Pleasant Sacred Heart; Jessie Rieth, Three Oaks River Valley; and Julia Diskin, West Bloomfield Frankel Jewish Academy.
Other Class D boys finalists for the Scholar-Athlete Award were: Jake Lane, Climax-Scotts; William Newbold, Frankfort; John Slivka, Manistee Catholic Central; Noah Krepostman, Mount Pleasant Sacred Heart; Brendan Zeien, Mount Pleasant Sacred Heart; and Brandon Scheurer, Portland St. Patrick.
The Class B scholarship award recipients will be announced Feb. 12, and the Class A honorees will be announced Feb. 19.
Farm Bureau Insurance of Michigan was founded in 1949 by Michigan farmers who wanted an insurance company that worked as hard as they did. Those values still guide the company today and are a big reason why it is known as Michigan’s Insurance Company, dedicated to protecting the farms, families, and businesses of this great state. Farm Bureau Insurance agents across Michigan provide a full range of insurance services—life, home, auto, farm, business, retirement, Lake Estate®, and more—protecting nearly 500,000 Michigan policyholders.
The MHSAA is a private, not-for-profit corporation of voluntary membership by more than 1,500 public and private senior high schools and junior high/middle schools which exists to develop common rules for athletic eligibility and competition. No government funds or tax dollars support the MHSAA, which was the first such association nationally to not accept membership dues or tournament entry fees from schools. Member schools which enforce these rules are permitted to participate in MHSAA tournaments, which attract more than 1.4 million spectators each year.