
Montrose Again SBP Program of the Year
By
John Johnson
MHSAA Communications Director emeritus
April 15, 2015
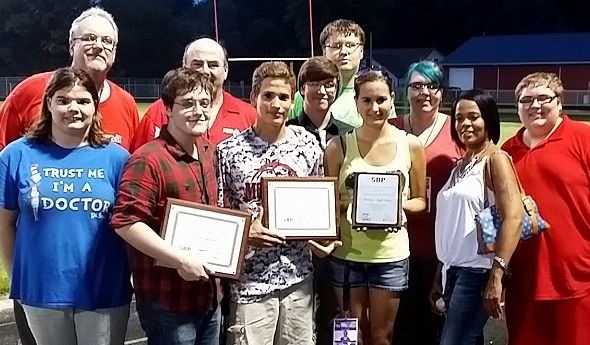
Capturing first place in three of five individual categories, Montrose High School repeated as the “Program of the Year” in the second annual MHSAA School Broadcast Program Excellence Awards for 2014-15.
The SBP Excellence Awards are underwritten by Herff Jones, which will award certificates and plaques to the schools which took individual honors, with the presentation dates and times to be announced.
Montrose took first place in Best Play-By-Play, Best Single Camera Production with PlayOn! Sports graphics, and the top two spots for Best Use of PlayOn! Sports Graphics. The program also took a second place for Best Produced Commercial/Feature and a third for Best Multicamera Production. Montrose also demonstrated during the school year a good blend of productions in a variety of sports covered and an overall command of the PlayOn! Sports software used for graphics and inserting commercials/features during the course of productions.
Other category winners were: Cedar Springs High School for Best Multicamera Production and Rogers City High School for Best Produced Commercial/Features.
Here is the complete list by categories of the schools and students being honored in this year’s SBP Excellence Awards:
Best Multicamera Production
First Place – Cedar Springs – Sam Owen, Sydney Dryer, Bryan Taylor, Alec Lachniet, Kaci Clark – Football game vs. Grand Rapids Northview.
Second Place – Cedar Springs – Rider Swanson, Sam Owens, Darrick Liggett, Kaci Clark, Cody Hoogerheide, Krystyn Messersmith – Football game vs. Ada Forest Hills Eastern.
Third Place – Montrose – Trey Schmitz, Andrew Morley, Amanda Ramsey, Nathan Brown, Eric Vandefifer, Brandon Smith – Genesee Area Conference Girls Competitive Cheer Finals.
Best Play-By-Play
First Place – Montrose – Eric Vandefifer, Trey Schmitz – Boys Basketball game vs. Lake Fenton.
Second Place – Rogers City – Casey Szatkowski – Girls Basketball game vs. Whittemore-Prescott.
Best Produced Commercial/Feature
First Place – Rogers City – Megan Brege, Heather Hentkowski, Ally Streich – Huron Halloween of Horror Feature.
Second Place – Montrose – Alyssa Bernard, Amanda Ramsey, Alicia Town, Allia Town – Sexual Assault PSA.
Third Place – Rogers City – Megan Brege, Heather Hentkowski, Ally Streich – Rogers City Girls Basketball Season Preview.
Best Single Camera Production with PlayOn! Graphics
First Place – Montrose - Trey Schmitz, Andrew Morley, Eric Vandefifer – Girls Soccer match vs. Hemlock.
Second Place – Rogers City – Brendan Koss, Sarah Meredith – Football game vs. Rudyard.
Third Place – Rogers City – Chandler Beland, Josh Foster – Girls Volleyball match vs. Posen.
Best Use of PlayOn! Graphics/Software
First Place – Montrose – Eric Vandefifer, Trey Schmitz, Andrew Morley, Griffin Powell, Bradley Payne – Boys Basketball game vs. Goodrich.
Second Place – Montrose – Eric Vandefifer, Trey Schmitz, Andrew Morley – Girls Basketball game vs. Lake Fenton.
Third Place – Rogers City - Victoria Bullock, Zachary Myers – Football game vs. Hillman.
The School Broadcast Program, powered by PlayOn! Sports, is a platform which schools can utilize to reach members of their community about activities taking place in their buildings, providing recognition for students while at the same time giving them hands-on opportunities to gain broadcasting experience and providing schools an opportunity to realize additional revenues for their programs.
Schools interested in becoming a part of the School Broadcast Program should contact John Johnson at the MHSAA Office.

Rules Changes Minimize Health Risks
August 3, 2017
By Geoff Kimmerly
Second Half editor
A pair of football rules changes taking effect this season build on continuing work to minimize health risks in all interscholastic sports as 2017-18 fall practices begin next week for member schools of the Michigan High School Athletic Association.
Practice in football must begin on Aug. 7 for all schools wishing to begin regular-season games the weekend of Aug. 24-26. Schools must have 12 days of preseason practice at all levels before their first game, over a period of 16 calendar days before the first kickoff.
Practice sessions for all other sports begin Wednesday (Aug. 9). In golf and tennis, competition may commence no earlier than after three separate days of team practice, and not before seven calendar days. The first day competition may take place in golf and tennis is Aug. 16. In all other fall sports, contests can take place after seven days of practice for the team and not before nine calendar days. The first day competition may take place in cross country, soccer, swimming & diving, and volleyball is Aug. 18.
This fall, two football game dates again precede Labor Day, and a number of MHSAA schools will play their first varsity games on Thursday, Aug. 24. In Week 1, 141 varsity games will be played on Thursday, 153 contests will be played on Friday, and 16 games will be played on Saturday. In the second week, four games will be played Wednesday, 238 games will take place Thursday, 64 will be played Friday, and five contests are Saturday.
A change to the allowable level of contact on a blindside block in football is one of the latest rules changes aimed at increasing player safety. A blindside block involves contact by a blocker against an opponent who, because of physical positioning and focus of concentration (for example, while following a ball carrier on a kickoff return), is vulnerable to injury by a block coming from outside his field of vision. Blindside blocks now must be initiated with open hands only; blindside contact that is forceful and initiated with other parts of the body outside of the free blocking zone will be penalized as excessive and unnecessary.
In addition to redefining the blindside block, the National Federation of State High School Associations (NFHS) sought to also minimize risk by eliminating the pop-up kick – that is, any free kick during which the kicker drives the ball immediately to the ground, causing it to bounce only once and into the air similar to the flight of a ball kicked directly off the tee. Kicks off a tee that bounce multiple times and then pop into the air remain allowed.
A few other notable rules changes in football will be apparent this fall:
• A defensive player will be called for encroachment for striking the offensive snapper’s hand or arm, or the ball, prior to the snapper releasing the ball to begin a play.
• Non-contact face guarding is no longer considered pass interference.
• A team accepting a penalty during the final two minutes of either half now will have the option of re-starting the clock at the snap of the ball rather than the referee’s ready-for-play signal.
While most fall sports face at least minor rules changes this season, a few more of the most noticeable adjustments will come in boys soccer and girls swimming & diving.
• In boys soccer, overtime periods and shootouts during the regular season have been eliminated. Leagues and conferences are allowed an overtime option for their end-of-season bracketed tournaments, but overtime in those cases must not exceed two 10-minute periods plus a shootout. Multi-team regular-season tournaments also may receive waivers to employ a shootout if it is used to determine the winner of a game.
• Also in soccer, kickoffs may now travel in any direction from the center of the field. Previously, kickoffs at the high school level were required to move forward down the field of play.
• In girls swimming & diving, a diver will need only four regular-season wins (instead of the previous five) to qualify for the Regional Diving Qualification Meet. A diver also may qualify if she places ahead of all divers from opposing schools in varsity competition in at least four meets, even if she does not finish ahead of her teammates.
• Also in swimming & diving, to promote safer take-offs during relays, the second, third and fourth swimmers must have at least one foot in contact with the starting platform in front of the starting block wedge during take-off. Those second, third and fourths swimmers may not take off with both feet on top of the starting block wedge.
The 2017 fall campaign culminates with postseason tournaments beginning with the Upper Peninsula Girls Tennis Finals the week of Sept. 25 and wraps up with the 11-Player Football Playoff Finals on Nov. 24 and 25. Here is a complete list of fall tournament dates:
Cross Country
U.P. Finals – Oct. 21
L.P. Regionals – Oct. 27 or 28
L.P. Finals – Nov. 4
11-Player Football
Selection Sunday – Oct. 22
Pre-Districts – Oct. 27 or Oct. 28
District Finals – Nov. 3 or 4
Regional Finals – Nov. 10 or 11
Semifinals – Nov. 18
Finals – Nov. 24-25
8-Player Football
Selection Sunday – Oct. 22
Regional Semifinals – Oct. 27 or Oct. 28
Regional Finals – Nov. 3 or 4
Semifinals – Nov. 11
Finals – Nov. 17
L.P. Girls Golf
Regionals – Oct. 11 or 12 or 13 or 14
Finals – Oct. 20-21
Soccer
Boys L.P. Districts – Oct. 16-21
Boys L.P. Regionals – Oct. 24-28
Boys L.P. Semifinals – Nov. 1
Boys L.P. Finals – Nov. 4
L.P. Girls Swimming & Diving
Diving Regionals – Nov. 9
Swimming/Diving Finals – Nov. 17-18
Tennis
U.P. Girls Finals – Sept. 27-30
L.P. Boys Regionals – Oct. 12 or 13 or 14
L.P. Finals – Oct. 20-21
Girls Volleyball
Districts – Oct. 30-Nov. 4
Regionals – Nov. 7 & 9
Quarterfinals – Nov. 14
Semifinals – Nov. 16-17
Finals – Nov. 18