
Multi-Sport Participation Holds Steady in 2023-24, Continuing Increases Found Over Entirety of Study
By
Geoff Kimmerly
MHSAA.com senior editor
January 16, 2025
The MHSAA’s sixth Multi-Sport Participation Survey, conducted last spring for the 2023-24 school year, showed for the third-consecutive year that nearly 45 percent of athletes at member high schools participated in more than one sport, while the entirety of the study continues to show that percentages of multi-sport athletes for all four Classes (A-B-C-D) have grown during the six years this topic has been studied in this way.
Early and intense sport specialization has become one of the most serious issues related to health and safety at all levels of youth sports, as overuse injuries and burnout among athletes have been tied to chronic injuries and health-related problems later in life. In early 2016, the MHSAA appointed a Task Force on Multi-Sport Participation as part of a continued effort to promote and protect participant health and address the issues leading to early sport specialization. The annual Multi-Sport Participation Survey was among results of the task force’s work.
The 2023-24 Multi-Sport Participation Survey received responses from 63.7 percent of member high schools and showed 44.8 percent of athletes at those MHSAA member high schools participating in two or more sports, a tenth of a percent increase from survey results in 2022-23 and half a percent increase from two years prior.
For 2023-24, 47.6 percent of male athletes and 41.4 percent of female athletes played multiple sports. Class D has enjoyed the highest percentage of multi-sport athletes over all six years of surveys, this time at 63.1 percent, followed by Class C (59.4), Class B (48.0) and Class A (38.2).
Over the six years of this survey, data also has shown slight increases in multi-sport participation in all four classes. Class A has risen from 35.9 percent in 2017-18 to 38.2 in 2023-24. Class B has risen from 46.7 to 48.0, Class C from 55.2 to 59.4 and Class D from 58.1 to 63.1 over those six years.
The MHSAA Task Force also recommended measuring multi-sport participation in MHSAA member schools to recognize “achievers” – that is, schools that surpass the norm given their enrollment and other factors that affect school sports participation.
Battle Creek Harper Creek, Detroit Cody and Grand Rapids Northview have appeared among the top 10 percent of their respective Classes five of the six years the survey has been conducted. Five more schools have appeared among the top 10 percent of their Classes four of the six years: Decatur, East Grand Rapids, Manton, Parma Western and Warren Michigan Collegiate.
In Class A, Macomb L’Anse Creuse North (94.7 percent) and Battle Creek Harper Creek (72.4) posted the highest percentages of multi-sport athletes for 2023-24, with Grand Rapids Northview (68.1), Berkley (65.0) and Kalamazoo Loy Norrix (64.3) also reporting reaching at least 60 percent. In Class B, four schools reached at least 65 percent multi-sport participation – Parma Western (78.0), Constantine (75.4), Clare (65.7) and Reed City (65.4).
Class C saw six schools reach 80 percent this past school year – Warren Michigan Collegiate (91.7 percent), Flint Beecher (91.3), LeRoy Pine River (89.5), Cass City (84.3), Decatur (83.3) and Manton (81.4). Four Class D schools responded at higher than 90 percent multi-sport participation – Gaylord St. Mary (92.9), Lake Leelanau St. Mary (91.7), Wyoming West Michigan Lutheran (90.9) and Deckerville (90.7) – followed by Marcellus Howardsville Christian (88.9), Morrice (86.8), Ewen-Trout Creek (85.7), Vestaburg (85.5) and Alanson (85.0).
Click for the full summary report on the Multi-Sport Participation Survey.
Legacies Live on in Matson's Work
By
Geoff Kimmerly
MHSAA.com senior editor
March 26, 2015
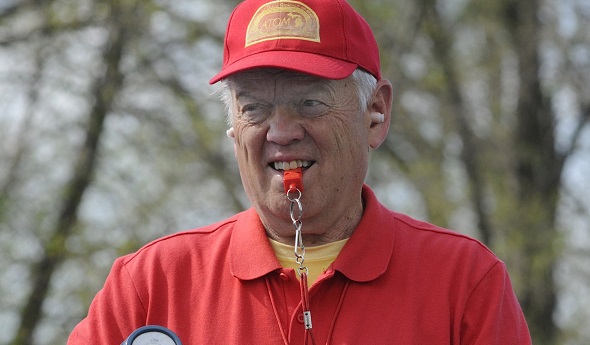
Hugh Matson was a sophomore on the 1951 Newaygo team that made the school's first trip to the MHSAA Boys Basketball Semifinals.
His team faced Dimondale in an auxiliary gym at Michigan State University’s Jenison Field House, but fell 56-54 in overtime when Dimondale scored the first basket of what was then a sudden-death extra period.
He watched the Class D championship game with some disappointment, knowing his team had come so close to playing on Jenison's main floor. But another highlight of that weekend has stuck with Matson, who has given back to high school sports as a teacher, coach, athletic director and official for more than 50 years.
After Matson and his team arrived in Lansing and checked into downtown’s Olds Hotel, they were directed to another room where they were welcomed by MHSAA executive director Charles E. Forsythe. It’s a memory Matson has enjoyed recalling recently – on Saturday, he will receive the honor bearing Forysthe’s name.
Matson will receive the 38th Charles E. Forsythe Award, for his long and various contributions to education athletics, during the first-quarter break of Saturday’s Class A Boys Basketball Final at the Breslin Center.
"That's very important to me. He was the big name in athletic administration when I got into it as an athletic director," Matson said. "He was known all over the United States as one of the great athletic directors, and I really feel honored. I'm humbled by it, naturally."
Forsythe was the MHSAA’s first full-time and longest-serving chief executive. Forsythe Award recipients are selected each year by the MHSAA Representative Council, based on an individual's outstanding contribution to the interscholastic athletics community.
Matson, 79, has deep roots in education. His mother Velma – who died in January at 104 years of age – was a longtime educator in Newaygo and with his father Francis established a scholarship for graduating seniors still awarded today. Hugh Matson took his first teaching job in 1957, at Mattawan, then followed older brothers Bill and Max to Saginaw Township Community Schools, teaching and coaching at Saginaw MacArthur High school from 1962-71 and then Saginaw Eisenhower from 1971-88.
Matson served as head varsity football and track and field coach at Mattawan and as head track and field coach at both MacArthur and Eisenhower, in addition to serving as an assistant football coach at both schools. He also became the first and only athletic director in Eisenhower’s history – holding that position from the school’s first day until the end of the 1987-88 school year, when he became co-athletic director of the new Saginaw Heritage High School, which was created from a merger of MacArthur and Eisenhower. Matson served as the sole full-time athletic director of Heritage for 1996-97 before retiring.
“Hugh has been dedicated to improving athletics in Michigan for more than 50 years, and his contributions stretch over every aspect of our games and beyond the Saginaw area,” MHSAA Executive Director John E. “Jack” Roberts said. “He showed leadership not only in his community for many years but at the statewide level among his colleagues, and continues his involvement as a valued official. We’re glad to honor Hugh Matson with the Forsythe Award.”
Matson has been a member of the Michigan Interscholastic Athletic Administrators Association (MIAAA) since 1970 and served as its president during the 1989-90 school year. He also was a member of the National Interscholastic Athletic Administrators Association (NIAAA) for three decades and has been a member of the Association of Track Officials of Michigan (ATOM) since 1993. Matson received distinguished service awards from both the MIAAA and ATOM and served as a representative and speaker for the MIAAA at regional conferences in Iowa and Wisconsin and to the NIAAA Leadership Forum in 1987.
 During his time as athletic director, Matson hosted MHSAA Districts or Regionals for seven sports. He’s been an MHSAA registered official since 1970 and has officiated 25 MHSAA Regionals in either cross country or track and field and 12 MHSAA Finals. He also has officiated cross country and track and field at the Division I, II and III and NAIA collegiate levels.
“Hugh was excellent with students, parents and staff during his 42 years as a teacher and coach at Eisenhower and Heritage High School. He is extremely positive with the kids as an official,” said current Saginaw Heritage athletic director Peter Ryan, also a member of the MHSAA Representative Council. “Hugh has been dedicated to improving athletics in the state of Michigan, and his passion for athletic officiating is contagious.”
“I still think I have the energy for it, and I enjoy it a lot,” Matson said. “Every day before I go to a track meet, my (wife Jackie) says, ‘Have fun.’ And she says when I come home, ‘Did you have fun?’ And yeah, I have fun. Working with younger people also, it keeps me youthful.”
Matson received his bachelor’s degree in physical education with minors in English and history in 1957 from Western Michigan University. He taught English and history at Mattawan, and then English and physical education during his three tenures as part of Saginaw Township Community Schools. In addition to his mother and brothers, Matson’s sister Joelyn also worked in education, recently retiring from the University of Toledo.
Past recipients of the Charles E. Forsythe Award
1978 - Brick Fowler, Port Huron; Paul Smarks, Warren
1979 - Earl Messner, Reed City; Howard Beatty, Saginaw
1980 - Max Carey, Freesoil
1981 - Steven Sluka, Grand Haven; Samuel Madden, Detroit
1982 - Ernest Buckholz, Mt. Clemens; T. Arthur Treloar, Petoskey
1983 - Leroy Dues, Detroit; Richard Maher, Sturgis
1984 - William Hart, Marquette; Donald Stamats, Caro
1985 - John Cotton, Farmington; Robert James, Warren
1986 - William Robinson, Detroit; Irving Soderland, Norway
1987 - Jack Streidl, Plainwell; Wayne Hellenga, Decatur
1988 - Jack Johnson, Dearborn; Alan Williams, North Adams
1989 - Walter Bazylewicz, Berkley; Dennis Kiley, Jackson
1990 - Webster Morrison, Pickford; Herbert Quade, Benton Harbor
1991 - Clifford Buckmaster, Petoskey; Donald Domke, Northville
1992 - William Maskill, Kalamazoo; Thomas G. McShannock, Muskegon
1993 - Roy A. Allen Jr., Detroit; John Duncan, Cedarville
1994 - Kermit Ambrose, Royal Oak
1995 - Bob Perry, Lowell
1996 - Charles H. Jones, Royal Oak
1997 - Michael A. Foster, Richland; Robert G. Grimes, Battle Creek
1998 - Lofton C. Greene, River Rouge; Joseph J. Todey, Essexville
1999 - Bernie Larson, Battle Creek
2000 - Blake Hagman, Kalamazoo; Jerry Cvengros, Escanaba
2001 - Norm Johnson, Bangor; George Lovich, Canton
2002 - John Fundukian, Novi
2003 - Ken Semelsberger, Port Huron
2004 - Marco Marcet, Frankenmuth
2005 - Jim Feldkamp, Troy
2006 - Dan McShannock, Midland; Dail Prucka, Monroe
2007 - Keith Eldred, Williamston; Tom Hickman, Spring Lake
2008 - Jamie Gent, Haslett; William Newkirk, Sanford-Meridian
2009 - Paul Ellinger, Cheboygan
2010 - Rudy Godefroidt, Hemlock; Mike Boyd, Waterford
2011 - Eric C. Federico, Trenton
2012 - Bill Mick, Midland
2013 - Jim Gilmore, Tecumseh; Dave Hutton, Grandville
2014 - Dan Flynn, Escanaba
The MHSAA is a private, not-for-profit corporation of voluntary membership by more than 1,400 public and private senior high schools and junior high/middle schools which exists to develop common rules for athletic eligibility and competition. No government funds or tax dollars support the MHSAA, which was the first such association nationally to not accept membership dues or tournament entry fees from schools. Member schools which enforce these rules are permitted to participate in MHSAA tournaments, which attract more than 1.4 million spectators each year.
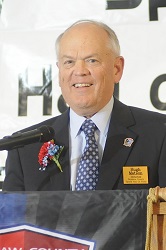
PHOTOS: (Top) Hugh Matson continues as an MHSAA official and has worked at all levels of college as well. (Middle) Matson accepts his induction into the Saginaw Sports Hall of Fame in 2014. (Photos courtesy of Saginaw Heritage High School.)