
NFHS Introduces Updated Logo
July 17, 2019
Special from NFHS
As the National Federation of State High School Associations (NFHS) heads into the next 100 years of leading high school sports and other activity programs nationwide, it will be doing so with a new logo.
 The new logo was unveiled to the membership earlier this month at the close of the NFHS Centennial Celebration. The NFHS and its 51-member state high school associations celebrated the organization’s accomplishments at the 100th Annual Meeting at the JW Marriott in downtown Indianapolis.
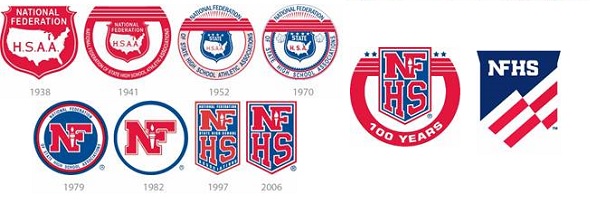
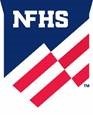
The organization will continue to be branded as the NFHS in the new logo, and the N and F are connected as has been the case since 1979. However, the entire acronym is together on one line as opposed to the previous logo with the NF and HS on separate lines. While red and blue will continue to be the predominant colors, the new logo mixes white with red and blue to suggest a flag waving in the wind. The direction of the flag is pointing upward to symbolize forward-thinking and advancement.
The new design maintains a resemblance to the shield that has been a part of the NFHS logo since 1997. However, the logo is flared at the top, and the bottom of the logo does not have definitive borders, which suggests the organization has moved past its first 100 years and is expanding its reach as the national leadership organization for high school sports and performing arts programs in the United States.
While the organization’s logo from 1952 had four stars to signify the four charter members of the NFHS, the four stripes within the new logo represent the four homes of the organization during the first 100 years.
“We wanted to retain NFHS as the central component of the new logo because the organization’s national presence has continued to spiral upward in the 22 years since the NFHS acronym was adopted,” said Dr. Karissa Niehoff, NFHS executive director. “However, as we celebrated our first 100 years, we felt it was important to establish a new look that would signify our ever-increasing role as the national leader in high school sports and performing arts programs.”
Counting the Centennial logo that was used during the 2018-19 school year, the new logo will be 10th used by the organization since the first one was adopted in the 1930s. The new logo was created by Section 127, an Indianapolis-based design company.
The NFHS was started in 1920 and had offices in Chicago until 1971, when it moved to Elgin, Illinois. The organization moved to Kansas City, Missouri, in 1979, and then in 2000 to Indianapolis, where it remains today.
The Michigan High School Athletic Association is a member of the NFHS, and Michigan is one of the four founding states of the national association.

Vermontville Star Named to NFHS Hall
By
Geoff Kimmerly
MHSAA.com senior editor
March 1, 2016
Record-setting Vermontville High School baseball star Ken Beardslee, who continues to hold two national strikeout records more than 65 years after his final high school pitch, was one of 12 individuals named Tuesday to the National High School Sports Hall of Fame by the National Federation of State High School Associations (NFHS).
 Beardslee, who died in 2007, will be inducted as one of five athletes selected for the 34th Hall of Fame class at a ceremony during the NFHS summer meeting July 2 in Reno, Nev.; the rest of the class is made up of coaches, administrators and an official. He was nominated through the Michigan High School Athletic Association.
Beardslee has been proclaimed as “prep baseball’s first ace” in the NFHS National High School Sports Record Book and was featured in the former print version of the book for his incredible feats from 1947-49. In his three years on the mound for Vermontville, Beardslee won 24 of his 25 starts (the team was 31-1 during that time). His 24 victories included eight no-hitters, with two perfect games, and seven one-hitters.
He set seven national records, and two still stand after 66 years: his per-game season strikeout mark of 19.0 and his per-game career strikeout mark of 18.1.
Beardslee will become the Hall of Fame’s eighth inductee from Michigan, joining Charles Forsythe, the first executive director of the Michigan High School Athletic Association (inducted 1983); River Rouge boys basketball coach Lofton Greene (1986), Warren Regina softball coach Diane Laffey (2000), Fennville basketball, football, track and baseball standout Richie Jordan (2001), Grosse Pointe Woods University Liggett boys and girls tennis coach Bob Wood (2005), Bloomfield Hills Cranbrook hockey standout Jim Johnson (2007) and Owosso football, basketball and baseball all-stater Brad Van Pelt (2011).
“It’s been said that records are made to be broken,” wrote MHSAA Executive Director John E. “Jack” Roberts in his letter supporting Beardslee’s nomination. “But the strikeout numbers Ken Beardslee recorded in the late 1940s have stood the test of time, just like some of the shutout and strikeout numbers 2009 Hall of Fame honoree David Clyde amassed some 20 years later. But Clyde never came close to Beardslee’s 19.0 Ks per game in a season or 18.1 per game for a career, and neither has anyone else.”
Beardslee is listed 10 times in the MHSAA record book. He shares the record for career no-hitters and is second with two career perfect games and a 0.32 career earned run average. In addition to his two national strikeout records still standing, he’s listed in the MHSAA records with games of 26, 25 (both extra innings) and 20 strikeouts (in seven innings) during the 1949 season. His 209 strikeouts that spring rank fourth for one season in MHSAA history, and his 452 over three seasons rank 12th on the career strikeouts list.
Beardslee was drafted by the New York Yankees immediately after graduating from high school and pitched in the minor leagues from 1949 to 1956, when an injury ended his playing career. Beardslee went on to scout for the Pittsburgh Pirates for 21 years, and he received a World Series ring after the team’s championship win in 1971. He also went on to write eight books including novels, poetry and an instructional on pitching.
He is survived by his wife Marilene, who is expected to attend the ceremony this summer to accept his honor.
The National High School Hall of Fame was started in 1982 by the NFHS. This year’s class increases the number of individuals in the Hall of Fame to 447.
The 12 individuals were chosen after a two-level selection process involving a screening committee composed of active high school state association administrators, coaches and officials, and a final selection committee composed of coaches, former athletes, state association officials, media representatives and educational leaders. Nominations were made through NFHS member associations. Also chosen for this class were athletes Steve Spurrier (Tennessee), Marlin Briscoe (Nebraska), Joni Huntley (Oregon) and Tom Southall (Colorado); coaches Chuck Kyle (Ohio), Peg Kopec (Illinois), Pete Boudreaux (Louisiana) and Jack Holloway (Delaware); administrators Tim Flannery (NFHS) and Ennis Proctor (Mississippi), and official Eugene “Lefty” Wright (Minnesota).
For more on this year’s Hall of Fame class, visit the NFHS Website. For more on Michigan’s past inductees, visit the MHSAA Website.