
Our Scoreboard = Your Scoreboard
December 6, 2011
We've undertaken a pretty major endeavor at the MHSAA this winter.
At this moment on Dec. 6, we have roughly 70 percent of all boys and girls basketball games scheduled by our teams for this winter entered into our system -- with the goal of keeping an up-to-date record of every schedule, every score and every league's standings.
That 70 percent might sound like barely passing -- until one considers that's more than 10,000 of a possible 15,000 games that will be played by MHSAA schools this winter.
It's a massive effort. Our athletic administrators, secretaries and coaches have helped a ton. But we'd greatly appreciate your help as well.
Like with football in the fall, anyone can report a score, tell us if we have one incorrect, or add an entire schedule at any time. Just go through a quick registration on our site, and become part of what we hope will be an impressive and useful library of information..
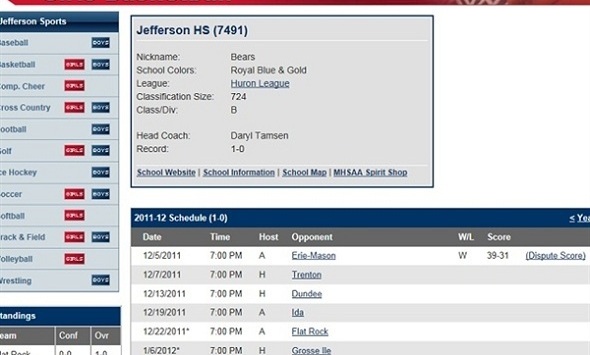
Click here to check out tonight's statewide schedule, or search for any night's games for the entire season. Click on a school name or search under "Schools" to see what we have for that team's full schedule. (Postseason games will be added later.)
And click here for the quick registration (it takes 15 seconds or fewer) if you'd like to give us a hand.
Photos: Top Shooters & Award Winners
March 26, 2019
By Geoff Kimmerly
Second Half editor
The MHSAA Girls & Boys Basketball Finals the last two weekends showed off many of the best teams and players who took the courts across Michigan this winter.
The championships also provided an opportunity to celebrate a few more accomplishments with the Basketball Coaches Association of Michigan “Top Shooters Challenge” contests and MHSAA recognition for leaders past, present and future.
Below are photos from a number of events that took place during quarter breaks and halftimes at Van Noord Arena this past weekend and the Breslin Center two weeks ago.
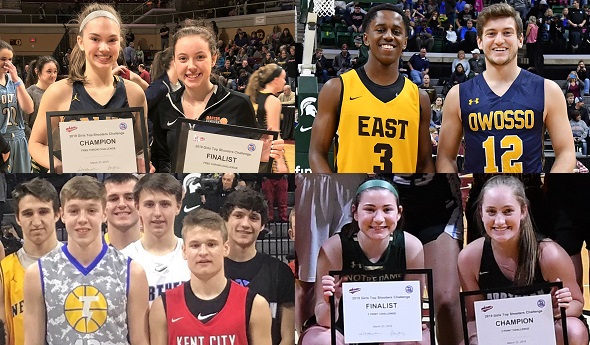
Top Shooters: This season’s BCAM top shooters contests again recognized the sharpest from the free-throw line and 3-point arc. This past weekend at Calvin College, Grand Rapids Forest Hills Northern’s Madi Stevenson won the 3-point contest with Pontiac Notre Dame Prep’s Sarah Stuart runner-up, while Saline’s Ella Stemmer won the free throw contest and Manton’s Abby Brown was second.
At Breslin, Mio’s Drew Hess won the 3-point challenge with Kent City’s Eli Carlson second. Zeeland East’s Clayton Dykhouse and Owosso’s Carson Bornefeld tied for the free throw championship.
(See photo above, clockwise from left: Girls free throw finalists, boys free throw finalists, girls 3-point finalists and boys 3-point finalists.)
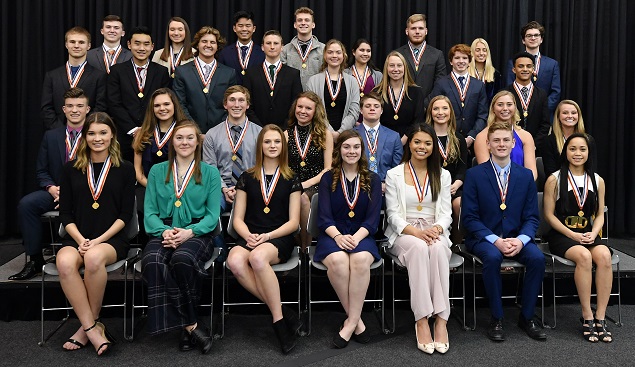
30th Scholar-Athlete Awards: Farm Bureau and the MHSAA presented 31 honorees with Scholar-Athlete Awards during Boys Finals weekend (one honoree was unable to attend). This year’s selections were honored at a banquet and then on the floor during halftime of the Division 3 Final.
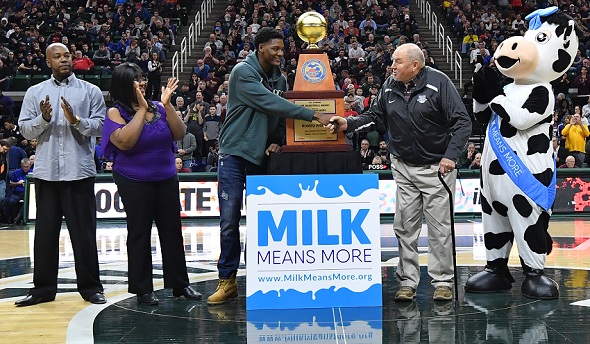
Miss Basketball & Mr. Basketball: Detroit Edison’s Rickea Jackson was recognized on-court as the Miss Basketball Award winner during Saturday’s Division 3 game before leading the Pioneers that evening to their third straight MHSAA title. Mr. Basketball Award honoree Romeo Weems accepted the trophy at Breslin as this year’s top senior on the boys side.
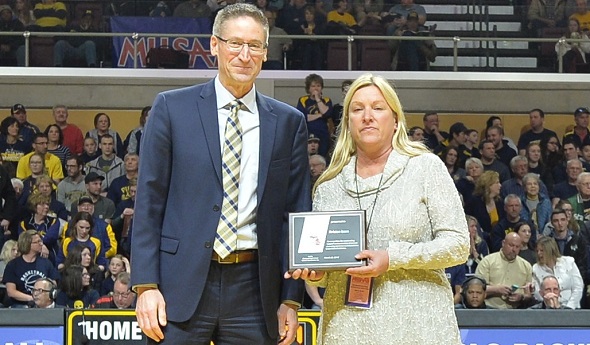
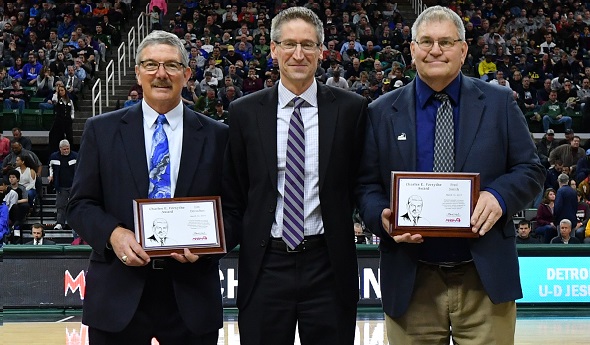
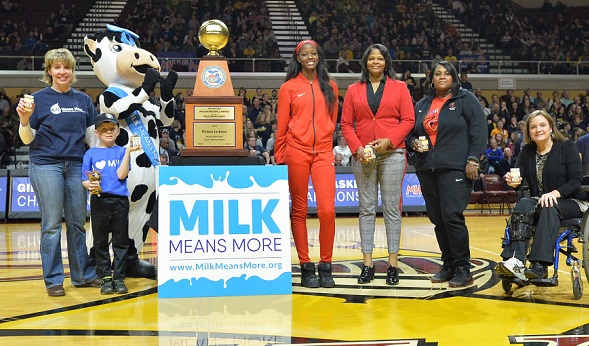
WISL & Forsythe Awards: Adrian Madison athletic director Kris Isom was honored Saturday as this year’s recipient of the MHSAA Women In Sports Leadership Award. The week prior, retired Negaunee and Brimley superintendent Jim Derocher and retired Buchanan, Benton Harbor, Comstock and St. Joseph Lake Michigan Catholic athletic director Fred Smith accepted Charles E. Forsythe Awards. All three were presented by Grand Haven Area Public Schools assistant superintendent Scott Grimes, who serves as president of the MHSAA’s Representative Council.
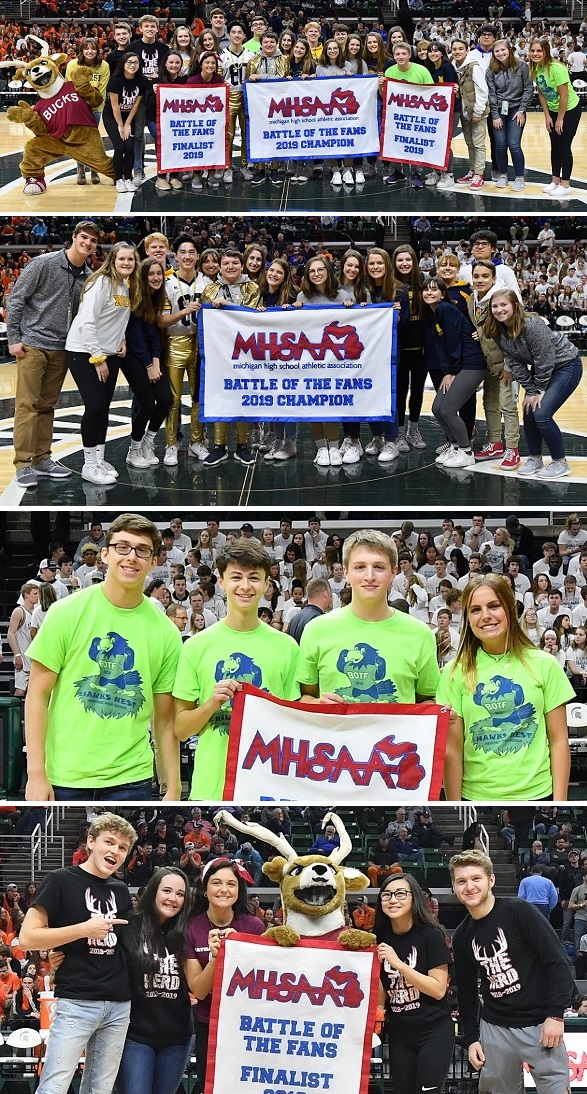
Battle of the Fans: Representatives from all three finalists from this year’s BOTF VIII – champion North Muskegon with Saginaw Heritage and Buchanan – took to the Breslin floor during the Division 2 Semifinals to receive their banners.