

Participation Again Outpaces Population
August 9, 2017
By Geoff Kimmerly
Second Half editor
Michigan had the eighth-most participants in high school sports nationally in 2016-17 according to statistics released this week by the National Federation of State High School Associations, after ranking seventh in participation the last eight school years.
However, this year’s level of participation again bested Michigan’s national ranking for total number of residents of high school age, which fell from ninth to 10th according to U.S. Census Bureau figures.
Michigan’s participation ranking was based on a number of 295,647, with 127,277 girls and 168,370 boys taking part in high school athletics, and included sports in which the MHSAA does not conduct postseason tournaments. The totals count students once for each sport in which he or she participates, meaning students who are multiple-sport athletes are counted more than once.
The state’s girls participation ranked eighth nationally, down one spot from 2015-16, while the boys participation figure also ranked eighth, down from sixth the year before. However, as with overall population, Michigan ranks 10th for both females and males ages 14-17 according to the latest U.S. Census Bureau estimates from 2016.
A total of 19 sports bested the state’s overall national participation ranking of eighth by placing seventh or higher on their respective lists. Three Michigan sports improved in national ranking during 2016-17, while five sports dropped one position and a sixth sport dropped two spots.
Michigan girls and boys golf both improved from sixth to fifth in national participation ranking, while girls basketball – with its first increase in participation after 10 straight years of decline – rose from seventh to sixth nationally. Michigan also moved up to seventh, from eighth, for 8-player football participation – significant because the state’s 11-player football participation ranking didn’t fall with that increase, remaining at sixth nationally for the fourth straight year.
Of the five sports that fell in national participation rankings in 2016-17, three stayed above population rank – boys basketball fell from sixth to seventh nationally, girls bowling from third to fourth and volleyball from fourth to sixth. Girls gymnastics (11th to 12th) and boys lacrosse (eighth to ninth) fell only one spot on their respective national lists.
The other Michigan sports that ranked eighth or higher all equaled their national rankings from 2015-16 and included baseball (eighth), boys bowling (third), competitive cheer (sixth), boys and girls cross country (both seventh), boys ice hockey (fourth), boys and girls skiing (both third), softball (seventh), boys tennis (fifth), girls tennis (third), boys track & field (seventh), girls track & field (eighth) and wrestling (seventh). Girls lacrosse (13th), boys and girls soccer (both ninth), boys swimming & diving (ninth) and girls swimming & diving (10th) all also held to their national rankings from the previous year.
National participation in high school sports in 2016-17 set a record for the 28th consecutive year with 7,963,535 participants – an increase of 94,635 from the year before. Girls participation increased for the 28th consecutive year with an additional 75,971 participants – the largest one-year jump since 2000-01 – and set an all-time high of 3,400,297. Boys participation also set another all-time high with 4,563,238, an increase of 18,664 participants from 2015-16.
Girls saw increases in all of their top-10 participatory sports, with competitive spirit (competitive cheer in Michigan) showing the largest increase of 18,712 participants nationally. Track & field, volleyball, soccer and lacrosse showed the next greatest increases among girls sports. Seven of the top 10 boys sports registered increases from 2015-16, led by soccer, track & field and cross country.
Football (1,086,748), while down two percent from 2015-16, again remained the most-played high school sport overall, followed by boys track & field (600,136), boys basketball (550,305), girls track & field (494,477) and baseball (492,935).
Providing Opportunities, Molding Leaders Most Rewarding for Hampton Honoree Thompson
By
Geoff Kimmerly
MHSAA.com senior editor
March 7, 2025
A leader on the basketball court as a high school and college standout, and then a leader in the classroom and at every level of educational administration over a 33-year career, Arnetta Thompson has been a staunch advocate for underrepresented groups in sports.
To recognize her work in creating opportunities for those groups, and all students, the Wyoming Godfrey-Lee Public Schools superintendent has been selected as the recipient of this year’s Nate Hampton Champion of Progress in Athletics Award by the Michigan High School Athletic Association.
The Hampton Award was created by the MHSAA’s Representative Council to honor Nate Hampton, who retired in 2021 after serving in education and educational athletics for 50 years, including the last 32 as an MHSAA assistant director. Honorees have championed the promotion and advancement of opportunities for women, minorities and other underrepresented groups within interscholastic athletics, while serving as an administrator, coach, official, educator or school sports leader in Michigan.
 Thompson is the second recipient of the award, as Novi principal Nicole Carter received the inaugural honor last year. Thompson will receive the Hampton Award during the MHSAA Boys Basketball Division 1 Final on March 15 at the Breslin Student Events Center in East Lansing.
“I just feel honored that I’m allowed to be in these spaces, to be selected as a principal or a superintendent, that people believe in me enough to believe I can help their students become better people and reach their goals,” Thompson said. “The rewarding part is seeing those students that you reconnect with or those you stay connected with and see what their paths in life become as a result of crossing paths with me.
“I’m passionate about students – especially students that are not always the top of the class, not the typical student – and helping guide them with the resources and with people that look like them and then opportunities to do some things they hadn’t done and didn’t even think they could do.”
Thompson is in her second school year as superintendent of Godfrey-Lee schools. She previously served 20 years in Grand Rapids Public Schools – as a teacher for six, then as an athletic director, assistant principal, instructional assistant principal and K-8 principal – and also served as an elementary curriculum specialist for Muskegon Public Schools and in multiple roles in the Muskegon Heights Public School Academy System including as superintendent during the 2021-22 school year. She began her professional career as a teacher in Memphis City, Tenn., schools after graduating from Tennessee Tech University.
She is a two-time appointee to the MHSAA Representative Council – previously serving from 2009-13 and currently a two-year term.
“Arnetta Thompson’s work to empower her students and those who have worked for her and with her is simply inspiring,” said MHSAA Executive Director Mark Uyl. “She has brought compassion and vision to every district with which she’s served. The Hampton Award recognizes promotion and advancement of underrepresented groups within interscholastic athletics, and Arnetta has continuously provided leadership in that area including now during a second tenure on the MHSAA Representative Council.”
Thompson earned her bachelor's degree in secondary education biology from Tennessee Tech in 1990, and her master’s in education with a concentration in educational leadership from Western Michigan University in 2001. She went on to also earn an educational specialist degree from Grand Valley State University in 2011 and her doctorate in philosophy from Eastern Michigan University in 2017.
During six years teaching at Memphis City, Thompson also served as varsity head coach of the girls basketball, volleyball and track & field teams. Coming to Grand Rapids Public Schools in 1997, she served as a lead teacher at Grand Rapids Union’s alternative high school, then as athletic director and assistant principal at Grand Rapids Creston. She also served as an assistant girls basketball coach at Grand Rapids Ottawa Hills for one season and coached the Grand Rapids Central varsity for four.
Thompson entered college on a pre-medical track. A professor noticed how she provided assistance to another student during a lab and suggested she consider education.
“My grandmother told me one time she thought I had a gift, and she wanted me to use that gift to fight for those who could not fight for themselves. Going into college with the mindset to go into medicine, and then my professor saying that, and talking with some of my colleagues at that time, I was moving in the direction of becoming an educator, and I thought that was the place for me,” Thompson said. (Education) has been even more than I anticipated. … Just the feeling of being an educator, just to give people opportunities, to mold our younger kids into great community leaders.”
Thompson earned eight varsity letters across three sports for Ottawa Hills before graduating in 1985, garnering all-state recognition in basketball and all-city in volleyball and also competing in track & field. She then played four seasons of basketball at Tennessee Tech, starting on the team that reached the NCAA Tournament in 1988-89.
Thompson has been married to her husband Willie for more than 30 years. They have two daughters, Daenetta Joseph and Arnell Thompson.
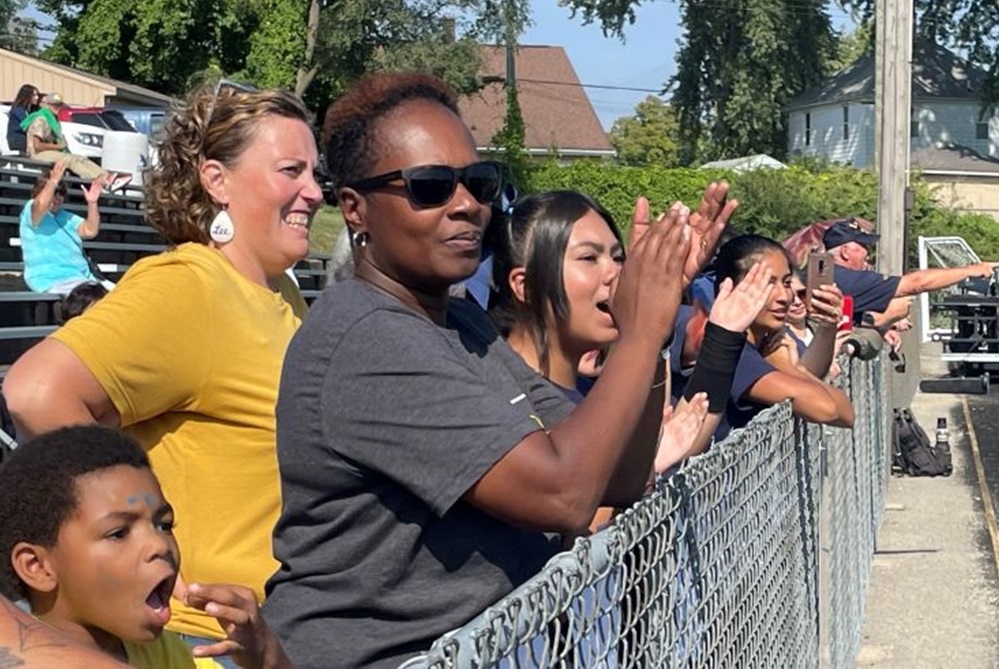
PHOTO Arnetta Thompson, third from left, claps during Godfrey-Lee's 100th anniversary celebration in 2023. (Photo courtesy of the Kent ISD/School News Network.)