

Participation Data Published for Abbreviated 2019-20 School Year
By
Geoff Kimmerly
MHSAA.com senior editor
April 26, 2021
Data collected from Michigan High School Athletic Association schools for the annual national participation study has been published, noting that comparisons of overall participation and Spring sports data to past years must include the context that Spring sports teams had not begun competition before sports were halted March 16, 2020, and eventually canceled, and that reporting for those sports may be incomplete.
The National Federation of State High School Associations (NFHS) did not publish results of its national survey for the 2019-20 school year. However, the data collected for MHSAA sports has been posted to the MHSAA Website; results from the 2000-01 school year to present may be viewed at www.mhsaa.com by clicking on Schools > Administrators > Sports Participation Listing.
A total of 274,126 participants competed or had begun practices in MHSAA-sponsored sports during the 2019-20 school year. The overall MHSAA participation totals count students once for each sport in which they participate, meaning students who are multiple-sport athletes are counted more than once.
Boys participation fell 2.7 percent to 157,323, and girls participation also decreased, by three percent to 116,803. However, both measures include totals received for Spring sports, which saw reduced participation reported in eight of nine sports offered and the majority by significant percentages indicating the effect of the COVID-19 stoppage.
However, data collected for the Fall and Winter revealed mostly consistent comparisons with eight sports showing increases in participation from 2018-19 and 11 showing decreases (not counting girls tennis, which is played in Fall in the Upper Peninsula but by the great majority of the state’s teams in the Lower Peninsula during Spring). Girls and boys bowling both set participation records with the girls total of 3,134 athletes up 1.3 percent over the previous season and the boys total of 4,495 up 3.8 percent over 2018-19.
Girls alpine skiing and wrestling enjoyed the second-largest percentage increases in participation in 2019-20 of three percent each, girls skiing to 786 athletes (the sport’s most since 2004-05) and wrestling to 9,777 participants. Volleyball bounced back from a dip in 2018-19 with an increase of nearly a percent to 19,248 participants, and boys swimming & diving similarly bounced back with a 1.1-percent increase to 5,059 participants. Girls golf (0.6 percent, 3,610 total participants) and boys tennis (1.3 percent, 6,339 athletes) also saw increases despite Upper Peninsula seasons in those sports not being played. Girls lacrosse, with 3,224 participants, was up 1.4 percent and set a record despite the sport being halted prior to the start of competition.
Of the 11 Fall and Winter sports that saw decreases in participation from 2018-19, eight were by 1.6 percent or less. Football, with 34,339 participants during the 2019 season, remained the most-played sport despite a 3-percent decrease from the previous year. Boys track & field (21,650) and boys basketball (21,016) had the next-highest totals of participants reported. Volleyball (19,248) remained the most popular girls sport by participation, followed by girls track & field (16,274) and girls basketball (15,133).
The following chart shows participation figures for the 2019-20 school year from MHSAA member schools for sports in which the Association sponsors a postseason tournament:
|
BOYS |
GIRLS |
|||
|
Sport |
Schools (A) |
Participants |
Schools (A) |
Participants (B) |
|
Baseball |
658/4 |
16,455 |
- |
0/4 |
|
Basketball |
737/3 |
21,005 |
729 |
15,133/11 |
|
Bowling |
418/15 |
4,469 |
407 |
3,134/26 |
|
Competitive Cheer |
- |
- |
361 |
6,567 |
|
Cross Country |
671/2 |
9,457 |
669 |
8,066/11 |
|
Football - 11 player |
560/87 |
32,628 |
- |
0/100 |
|
8-player |
93/16 |
1,591 |
- |
0/20 |
|
Golf |
531/66 |
5,729 |
351 |
3,610/132 |
|
Gymnastics |
- |
- |
102 |
666 |
|
Ice Hockey |
295/10 |
3,261 |
- |
315/11 |
|
Lacrosse |
171/10 |
5,305 |
122 |
3,224/14 |
|
Skiing |
116/2 |
916 |
114 |
786/3 |
|
Soccer |
503/16 |
14,195 |
484 |
12,429/69 |
|
Softball |
- |
- |
648 |
12,657 |
|
Swimming & Diving |
274/22 |
4,987 |
273 |
5,474/72 |
|
Tennis |
310/18 |
6,304 |
340 |
8,621/35 |
|
Track & Field |
696/1 |
21,645 |
694 |
16,274/5 |
|
Volleyball |
- |
- |
720 |
19,248 |
|
Wrestling |
492/216 |
9,376 |
- |
0/401 |
(A) The first number is the number of schools reporting sponsorship on the Sports Participation Survey, including primary and secondary schools in cooperative programs as of May 15, 2020. The second number indicates the number of schools that had girls playing on teams consisting primarily of boys.
(B) The second number indicates the number of additional girls playing on teams consisting primarily of boys and entered in boys competition.
The MHSAA is a private, not-for-profit corporation of voluntary membership by more than 1,500 public and private senior high schools and junior high/middle schools which exists to develop common rules for athletic eligibility and competition. No government funds or tax dollars support the MHSAA, which was the first such association nationally to not accept membership dues or tournament entry fees from schools. Member schools which enforce these rules are permitted to participate in MHSAA tournaments, which attract more than 1.4 million spectators each year.
Scholars and Athletes 2014: Class C, D
By
Geoff Kimmerly
MHSAA.com senior editor
February 4, 2014
By Geoff Kimmerly
Second Half editor
The Michigan High School Athletic Association has selected 10 student-athletes from Class C and D member schools to receive scholarships through its Scholar-Athlete Award program.
 Farm Bureau Insurance, in its 25th year of sponsoring the award, will give $1,000 college scholarships to 32 individuals who represent their member schools in at least one sport in which the Association sponsors a postseason tournament. The first 30 scholarships are awarded proportionately by school classification and the number of student-athletes involved in those classes; also, there are two at-large honorees which can come from any classification.
Each of the scholarship recipients will be honored at halftime ceremonies of the Class C Boys Basketball Final game March 22 at the Breslin Student Events Center in East Lansing. Commemorative medallions will be given to the finalists in recognition of their accomplishments.
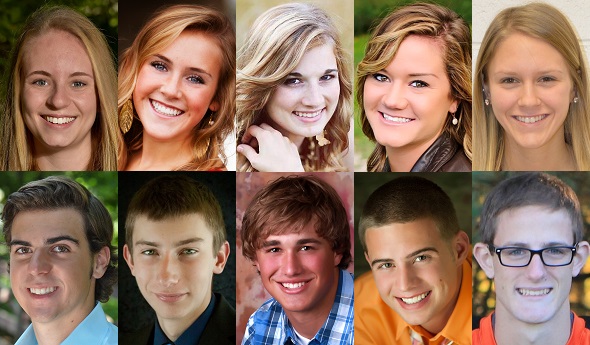
The Class C Scholar-Athlete Award honorees are: Melissa Dowell, Clinton; Erin McDonnell, Traverse City St. Francis; Kirsten Olling, Breckenridge; Stephen T. Erwin, Royal Oak Shrine Catholic; Devin Morrow, Three Oaks River Valley; and Ty Michael Rollin, Beal City.
The Class D Scholar-Athlete Award recipients are: MacKenzie Ciganick, Bellaire; Sara Inbody, Deckerville; Grant Hohlbein, Adrian Lenawee Christian; and Steven McKenzie, Marcellus.
Overviews of the scholarship recipients of the Class C Scholar-Athlete Award follow. A quote from each recipient's essay also is included:
Melissa Dowell, Clinton
Played volleyball, basketball and softball during her high school career and expects to finish with four varsity letters in softball. Contributed to softball teams that won two MHSAA Finals, three District and three Tri-County Conference championships, and played on a District champion in volleyball. Named Most Improved Player in softball as a sophomore and the same for volleyball as a junior; also named volleyball team captain this fall. Served in student government three years including as student body treasurer and secretary this year. Also serves as secretary of her National Honor Society chapter and editor of the yearbook, and is ranked academically among the top 10 in her class. Volunteered multiple times for the Dearborn Firefighters Burn Drive and earned CPR certification. Will attend Siena Heights University and study nursing.
Essay Quote: “Playing on a state championship softball team has been an incredible experience. More amazing, however, has been the journey and the lessons learned along the way. I learned that good sportsmanship is like a sacrifice bunt. When I’m given the sign, I step up to the plate and execute without question. I don’t expect a display of fireworks or a grand headline in a newspaper.”
Erin McDonnell, Traverse City St. Francis
Participated in cross country, basketball and track and field and anticipates graduating with eight varsity letters. Ran on MHSAA Lower Peninsula Division 4 champion 1,600-meter relay in 2012 when St. Francis finished team runner-up and was a contributor when the Gladiators won the team championship in 2013. Served as a captain on her cross country and track and field teams in 2013 and her junior varsity basketball team. Earned individual academic all-state honors in cross country three times and a variety of other team, league and region awards for athletic and academic performance. Participated in her school’s Key Club all four years of high school, its National Honor Society chapter as a junior and senior and as student body treasurer this school year. Undecided on where she will attend college but plans to study biology.
Essay Quote: “Compassion from a sportsmanship standpoint is simply respect. Through good sportsmanship, we develop and show compassion by actions such as lending a hand to another teammate (who) has fallen down or congratulating a team after a hard-fought win. ... By having compassion in sportsmanship, we show a love and respect for others leading to nothing but appreciation and respect in return. “
Kirsten Olling, Breckenridge
Became the seventh in MHSAA girls cross country history to win four Finals championships and set the Lower Peninsula Division 4 Finals record with a time of 17:44.9. Also won the MHSAA Lower Peninsula Division 4 3,200-meter run championship the last three seasons and the 1,600 as a freshman. Served as captain of her cross country team the last three seasons and her track and field team. Named academic all-state in cross country three seasons. Served as her class’ vice president and the yearbook sports editor and won multiple leadership awards as part of the Future Farmers of America. Served as an assistant coach for her local Girls on the Run program. Will attend Arizona State University and study biology with a minor in kinesiology.
Essay Quote: “Sportsmanship is more than just playing fair. True sportsmanship is knowing that your opponent has the same goals, helping others reach those goals and working hard every day. ... I get excited when I hear I get to race against the best. Sportsmanship is not about being happy even if you lose, but it is about helping your competition be their best.”
Stephen T. Erwin, Royal Oak Shrine Catholic
Participated in three years of varsity football, two of varsity ice hockey and expects to play his fourth season of varsity baseball this spring; also played two seasons of junior varsity basketball. Earned all-state honorable mention as a hockey goaltender and all-league baseball honors the last two seasons. Served as captain of his junior varsity basketball team and has been named captain of the baseball team for this spring. Served as student council class treasurer all four years of high school and has been a member of the National Honor Society for three years. Named Homecoming King this fall and earned Shrine Knight Award as the Most Outstanding Freshman Student. Serves as leader of the Shrine Service Club and has participated for four years as a coach and counselor in the Angel’s Place summer baseball program. Will attend Saint Louis University in Missouri and study either sports business or aviation.
Essay Quote: “A display of sportsmanship is important in educational athletics because it acknowledges the respect of other athletes and their roles. Simple handshakes after the game or some action on a bigger level are ways to show sportsmanship. ... Sportsmanship, in my mind, is not only respect but also caring for another athlete who has similar goals.”
Devin Morrow, Three Oaks River Valley
Participated in varsity cross country, basketball, golf and track and field and anticipates graduating with 10 varsity letters including four in golf. Served as his golf team’s captain three seasons and also as a basketball and cross country co-captain. Has participated in student government, National Honor Society and Business Professionals of America all for three years, and Students Against Destructive Decisions and his school’s band and drama club for four years. Served as his class’ president the last three years and also as president of his SADD and NHS chapters. Received Best Drum Major award at the Hastings Marching Invitational. Volunteered for three years as part of a Michigan Department of Transportation Highway Cleanup community service project. Will attend the University of Michigan and study engineering.
Essay Quote: “Sportsmanship is much more than following the rules of the game. Sportsmanship allows for a highly competitive sporting event to maintain a dignified manner no matter the outcome. ... All in all, it makes sense to look at sportsmanship in a similar way that we view friendship – treat the people you play with and against as you would like to be treated yourself.”
Ty Michael Rollin, Beal City
Played four seasons of varsity football, two of basketball and will play his fourth season of varsity baseball this spring. Earned all-state honors in football as a senior and honorable mention as both a sophomore and junior, and also earned all-state honors in baseball as a sophomore (second team) and junior (first team). Contributed to a football MHSAA Finals runner-up finish in 2012 and a baseball MHSAA runner-up in 2013, and also to a Regional championship in basketball. Served as a coach at Beal City’s youth basketball camp the last four years and coached the eighth grade football team that finished league champion. Earned his school’s Principal’s Award as both a freshman and junior and participated in the Natural Helpers peer assistance program for two years. Will attend Central Michigan University and study pre-medical and dentistry.
Essay Quote: “A positive attitude regarding my own performance, my coaches, my teammates and my opponents is of utmost importance when it comes to good sportsmanship. ... I am a strong believer in not engaging in negative speech of any kind with my opponents. Being a team captain and a leader for many sports teams, throughout the year, I am constantly reminding my teammates to just walk away when an opponent is talking ‘smack.’”
Other Class C girls finalists for the Scholar-Athlete Award were: Korinna Corbin, Addison; Elizabeth Baker, Bronson; Amanda Reagle, Homer; Mandy Haferkorn, Iron Mountain; Megan Chapman, Ishpeming Westwood; Keara Wilson, Marlette; Grace Leighton, Mendon; Allie Kendall, Saginaw Nouvel; and Kari Feddema, Schoolcraft.
Other Class C boys finalists for the Scholar-Athlete Award were: Matthew S. Johnson, Fennville; Carter Ballinger, Jonesville; Luke Joseph Smigielski, Mancelona; Dakota Hall, Marlette; Bradley Schaub, Marlette; Kyle Baxter, Mayville; Jason Beckman, Shelby; James Barber, St Charles; and Nicholas DeSimpelare, Unionville-Sebewaing.
Overviews of the scholarship recipients of the Class D Scholar-Athlete Award follow. A quote from each recipient's essay also is included:
MacKenzie Ciganick, Bellaire
Played four seasons on the boys soccer team, three of basketball and will run her fourth season with the track and field team this spring. Qualified for the MHSAA Finals in track and field the last two seasons when she also served as a captain, and earned all-league honors the last three years. Played on a league and Regional champion soccer team this fall and a two-time District finalist basketball team. Earned academic all-state honors the last three years in soccer and academic all-conference the last three in track and field. Has maintained all A’s through every marking period of high school and will graduate as her class' co-salutatorian. Participated in National Honor Society for two years, on the school’s athletic council as a sophomore and as her church’s teen representative the last two years. Also has served as school president for the Antrim County Youth Coalition the last two years. Will attend Capital University in Columbus, Ohio, to study pre-physician assistant.
Essay Quote: “Sportsmanship in educational athletics goes far beyond shaking hands at the end of the game. I learned lessons ... throughout my four years of participating in high school sports that have shaped me as a human being.”
Sara Inbody, Deckerville
Played two seasons of varsity volleyball, three of varsity basketball and will play her third on the softball team this spring. Served as captain of all three teams and helped all three win league titles and the volleyball and basketball team to District championships. Received all-league honors or honorable mention in all three sports. Served on student government all four years of high school including three as class president and this year as class vice president. Also participated in National Honor Society the last three years including as secretary of her chapter the last two. Earned Principal’s Award and Outstanding Student Award from the Sanilac County Career Center in 2011. Also participated in Health Occupations Students of America and as a volunteer tutor. Will attend Central Michigan University and study pre-medical with a focus on pediatrics.
Essay Quote: “Helping another person in a way that seems effortless to you, such as picking them up when they are on the ground during a game, is just one simple way to show sportsmanship and get others to realize how big of a difference you can make for somebody.”
Grant Hohlbein, Adrian Lenawee Christian
Played four years of varsity basketball and will play his fourth of varsity baseball this spring, plus three of varsity football and junior varsity as a sophomore when the varsity was eliminated because of a lack of players. Earned all-state and academic all-state honors for baseball, all-league in football as both a junior and senior, and all-county honors in basketball. Served on student council the last three years including as president as a senior. Participated in National Honor Society the last two years and as an international student conversation partner this year. Coached as part of the Lenawee Christian Cougar Camp for four years and officiated football, basketball and baseball for three years for the Christian Family Centre Impact Sport Leagues. Will attend Grand Canyon University in Arizona to study pre-medical.
Essay Quote: “Humanity is resilient, but it is up to us on how quickly we recover from loss. In sports, it is important to learn how to lose just as it is important to learn how to win. A good sport doesn’t let his emotions dictate his behavior.”
Steven McKenzie, Marcellus
Expects to graduate with 15 varsity letters after participating in three years of football and four each of wrestling, cross country and track and field. Served as captain of the football and wrestling teams and helped the football team to a winning record in 2012, its first since 2003. Earned all-league honors in football. Holds a 4.0 grade-point average and is a three-year member of both the National Honor Society and Spanish Honor Society, holding positions of vice president and president, respectively, in his school’s chapters. Also served on his Principal’s Advisory Council for three years and participated in marching band, concert band and 4-H for four years. Earned his student council’s Citizenship Award and also attended the statewide Young People’s Citizenship Seminar. Will attend Michigan State University and study agronomy, soil science and plant science.
Essay quote: “An athlete with good sportsmanship not only strives to improve but strives to improve for the team, not for selfish pride and glory. Anybody who can put (his or her) pride on the line in exchange for good sportsmanship is a champion. Not everybody is willing to work hard for the greater good, no matter how beneficial.”
Other Class D girls finalists for the Scholar-Athlete Award were: Julie Ahnen, Bessemer; Vanessa Freberg, Eben Junction Superior Central; Kari Borowiak, Gaylord St Mary; Lyvia Deaver, Jackson Christian; Erin Gast, Lake Linden-Hubbell; and Jennifer Malcolm, Plymouth Christian.
Other Class D boys finalists for the Scholar-Athlete Award were: Bret Hiveley, AuGres-Sims; Tyler Anthony Johnson, Bear Lake; Jeremy Bigalke, Manistee Catholic Central; Ben Feliczak, Manistee Catholic Central; Alec Firack, Pickford; and Harding Fears III, Southfield Christian.
Students applying for the Scholar-Athlete Award must be carrying at least a 3.5 (on a 4.0 scale) grade-point average and have previously won a letter in a varsity sport in which the Michigan High School Athletic Association sponsors a postseason tournament. Other requirements for the applicants were to show active participation in other school and community activities and produce an essay on the importance of sportsmanship in educational athletics.
The Class B scholarship award recipients will be announced on Feb. 11, and the Class A honorees will be announced on Feb. 18.
Farm Bureau Insurance, one of Michigan's major insurers, has a statewide force of more than 400 agents serving more than 380,000 Michigan policyholders. Besides providing life, home, auto, farm, business and retirement insurance, the company also sponsors life-saving, real-time Doppler weather tracking systems in several Michigan communities.
The MHSAA is a private, not-for-profit corporation of voluntary membership by more than 1,500 public and private senior high schools and junior high/middle schools which exists to develop common rules for athletic eligibility and competition. No government funds or tax dollars support the MHSAA, which was the first such association nationally to not accept membership dues or tournament entry fees from schools. Member schools which enforce these rules are permitted to participate in MHSAA tournaments, which attract more than 1.4 million spectators each year.