

Participation Data Published for Abbreviated 2019-20 School Year
By
Geoff Kimmerly
MHSAA.com senior editor
April 26, 2021
Data collected from Michigan High School Athletic Association schools for the annual national participation study has been published, noting that comparisons of overall participation and Spring sports data to past years must include the context that Spring sports teams had not begun competition before sports were halted March 16, 2020, and eventually canceled, and that reporting for those sports may be incomplete.
The National Federation of State High School Associations (NFHS) did not publish results of its national survey for the 2019-20 school year. However, the data collected for MHSAA sports has been posted to the MHSAA Website; results from the 2000-01 school year to present may be viewed at www.mhsaa.com by clicking on Schools > Administrators > Sports Participation Listing.
A total of 274,126 participants competed or had begun practices in MHSAA-sponsored sports during the 2019-20 school year. The overall MHSAA participation totals count students once for each sport in which they participate, meaning students who are multiple-sport athletes are counted more than once.
Boys participation fell 2.7 percent to 157,323, and girls participation also decreased, by three percent to 116,803. However, both measures include totals received for Spring sports, which saw reduced participation reported in eight of nine sports offered and the majority by significant percentages indicating the effect of the COVID-19 stoppage.
However, data collected for the Fall and Winter revealed mostly consistent comparisons with eight sports showing increases in participation from 2018-19 and 11 showing decreases (not counting girls tennis, which is played in Fall in the Upper Peninsula but by the great majority of the state’s teams in the Lower Peninsula during Spring). Girls and boys bowling both set participation records with the girls total of 3,134 athletes up 1.3 percent over the previous season and the boys total of 4,495 up 3.8 percent over 2018-19.
Girls alpine skiing and wrestling enjoyed the second-largest percentage increases in participation in 2019-20 of three percent each, girls skiing to 786 athletes (the sport’s most since 2004-05) and wrestling to 9,777 participants. Volleyball bounced back from a dip in 2018-19 with an increase of nearly a percent to 19,248 participants, and boys swimming & diving similarly bounced back with a 1.1-percent increase to 5,059 participants. Girls golf (0.6 percent, 3,610 total participants) and boys tennis (1.3 percent, 6,339 athletes) also saw increases despite Upper Peninsula seasons in those sports not being played. Girls lacrosse, with 3,224 participants, was up 1.4 percent and set a record despite the sport being halted prior to the start of competition.
Of the 11 Fall and Winter sports that saw decreases in participation from 2018-19, eight were by 1.6 percent or less. Football, with 34,339 participants during the 2019 season, remained the most-played sport despite a 3-percent decrease from the previous year. Boys track & field (21,650) and boys basketball (21,016) had the next-highest totals of participants reported. Volleyball (19,248) remained the most popular girls sport by participation, followed by girls track & field (16,274) and girls basketball (15,133).
The following chart shows participation figures for the 2019-20 school year from MHSAA member schools for sports in which the Association sponsors a postseason tournament:
|
BOYS |
GIRLS |
|||
|
Sport |
Schools (A) |
Participants |
Schools (A) |
Participants (B) |
|
Baseball |
658/4 |
16,455 |
- |
0/4 |
|
Basketball |
737/3 |
21,005 |
729 |
15,133/11 |
|
Bowling |
418/15 |
4,469 |
407 |
3,134/26 |
|
Competitive Cheer |
- |
- |
361 |
6,567 |
|
Cross Country |
671/2 |
9,457 |
669 |
8,066/11 |
|
Football - 11 player |
560/87 |
32,628 |
- |
0/100 |
|
8-player |
93/16 |
1,591 |
- |
0/20 |
|
Golf |
531/66 |
5,729 |
351 |
3,610/132 |
|
Gymnastics |
- |
- |
102 |
666 |
|
Ice Hockey |
295/10 |
3,261 |
- |
315/11 |
|
Lacrosse |
171/10 |
5,305 |
122 |
3,224/14 |
|
Skiing |
116/2 |
916 |
114 |
786/3 |
|
Soccer |
503/16 |
14,195 |
484 |
12,429/69 |
|
Softball |
- |
- |
648 |
12,657 |
|
Swimming & Diving |
274/22 |
4,987 |
273 |
5,474/72 |
|
Tennis |
310/18 |
6,304 |
340 |
8,621/35 |
|
Track & Field |
696/1 |
21,645 |
694 |
16,274/5 |
|
Volleyball |
- |
- |
720 |
19,248 |
|
Wrestling |
492/216 |
9,376 |
- |
0/401 |
(A) The first number is the number of schools reporting sponsorship on the Sports Participation Survey, including primary and secondary schools in cooperative programs as of May 15, 2020. The second number indicates the number of schools that had girls playing on teams consisting primarily of boys.
(B) The second number indicates the number of additional girls playing on teams consisting primarily of boys and entered in boys competition.
The MHSAA is a private, not-for-profit corporation of voluntary membership by more than 1,500 public and private senior high schools and junior high/middle schools which exists to develop common rules for athletic eligibility and competition. No government funds or tax dollars support the MHSAA, which was the first such association nationally to not accept membership dues or tournament entry fees from schools. Member schools which enforce these rules are permitted to participate in MHSAA tournaments, which attract more than 1.4 million spectators each year.
'Mailloux Management' Goes Global
By
Geoff Kimmerly
MHSAA.com senior editor
December 17, 2013
By Geoff Kimmerly
Second Half editor
Leslie (Barnhart) Mailloux graduated from Ogemaw Heights High School in 1999 and since has lived in New Mexico, Texas and Ohio twice.
She’s traveled to parts of Africa and Europe multiple times, plus Haiti, with a voyage to Switzerland planned for next month.
She’s served as a supervisor in a foreign exchange program, mentoring students as they make adjustments to living in the U.S.
 Needless to say, Mailloux has gained plenty of worldly knowledge since becoming an MHSAA Scholar-Athlete Award winner as a high school senior in 1999.
“It was good to get out of the small-town America, meeting people of all walks of life,” Mailloux said. “People are different, but we’re all doing the same things: having families, working. We just do it differently.
“We’re all different, but we’re all the same. We’re on this planet for a reason ... and we can learn from each other.”
 A three-sport athlete – who played volleyball, basketball and soccer – Mailloux (pronounced May-you) was one of 24 scholar-athletes recognized during the winter of 1999 by the MHSAA and Farm Bureau Insurance, which continues to sponsor the Scholar-Athlete Award program that has grown to 32 recipients. In advance of this March’s 25th celebration, Second Half is catching up with some of the hundreds who have been recognized.
Leaving home
Mailloux, now 32, met her husband Logan while earning a degree in architecture at Southfield’s Lawrence Technological University.
Logan grew up in Farmington Hills and when they met told Leslie he never wanted to leave Michigan. But that was before he joined the Air Force and ascended to the rank of major, which led to the family's moving to the southwest and now back to the Dayton, Ohio, area for the second time.
When Leslie and Logan moved to New Mexico, she had initial thoughts they’d landed in a ugly desert. But they fell in love with their new home: “You learn to appreciate different kinds of beauty. Fountains, blue skies, you appreciate the creation,” she said. “You really have to keep your eyes open.”
While in New Mexico, Mailloux found a way to mix working abroad with an opportunity to become involved in that community. Through a posting on Craig’s List she landed with the Council of International Education Exchange, a program that specializes in study abroad. As a coordinator for the CIEE, she helped foreign students “make the jump” to living here while providing them support and mentoring.
She also has managed to stay active athletically, playing volleyball competitively including on two teams that have advanced to USAV national tournaments. And she has passed on the lessons she's learned on the court and field during two high school coaching stops, including as the varsity head coach at Dayton Christian High School during the couple's first stop in Ohio.
“Hard work does pay off,” Mailloux said of her coaching focus. “Obviously (my players) had some God-given talent; some had a lot of talent and some a little. But with hard work they could be good, whether it’s in a sport, career or school. If you work hard, you’ll succeed.”
Traveling abroad
Mailloux no doubt has seen plenty as well during her international travels, including the mission trip she took to Haiti while in college. But her favorite excursion surely came a little more than three years ago, when Mailloux and her husband journeyed to Ethiopia to bring home their adopted twin sons.
Leslie had hoped to adopt siblings and was drawn to Ethiopia with a sister living there at the time. After some prayerful consideration, she and Logan began a two-year process that led to then 6-month-old boys Nathan and Issac becoming part of Mailloux family.
“Finally having the babies in our arms that God wanted us to have, it was a beautiful moment,” Mailloux said.
Her sons “are all boys, 250 percent," and keep her running around most of the day – Mailloux calls that fulltime job “Mailloux Management.” But she also does contract residential design work for Archetype Designs, a firm based in Texas.
She wasn’t alone among family members who journeyed far from home. In addition to her sister who lived in Ethiopia for three years, another sister plus her brother both moved to Seattle.
The sister in Seattle has moved back to Michigan, and the Maillouxs now are only six hours from West Branch. It could be only a matter of time before Leslie and Logan consider making good on his original desire to stay close to home now that they've experienced so much in this country and abroad.
“When it’s your roots, it’s still in your blood,” Leslie said. “We still love Michigan.”
Click to read the series' first installments:
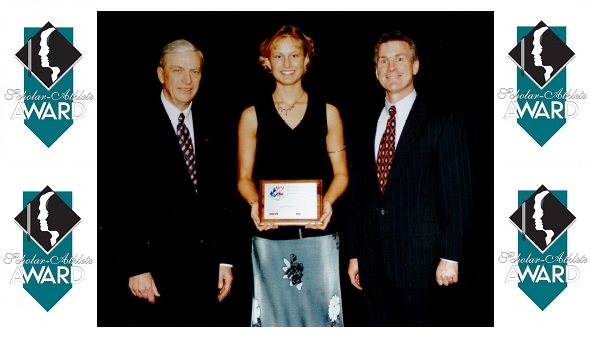
PHOTO: Ogemaw Heights' Leslie Barnhart (middle) poses with her Scholar-Athlete Award next to Larry Thomas (left), the then-executive vice president of Farm Bureau Insurance, and MHSAA Executive Director Jack Roberts.