

Participation Fees Rise Again
December 19, 2013
By Geoff Kimmerly
Second Half editor
The use of participation fees to help fund interscholastic athletics in Michigan high schools for the first time rose significantly above 50 percent during the 2012-13 school year, according to the most recent survey taken by the Michigan High School Athletic Association of its member institutions.
Use of fees had held steady at just above 50 percent over the last two school years, 2010-11 and 2011-12. But the most recently completed survey indicated that of 450 member schools participating, 249 schools – 55.3 percent – charged participation fees during the 2012-13 school year.
There were 758 senior high schools in the MHSAA membership in 2012-13 – the survey generated a response rate of 59 percent. This was the ninth survey of schools since the 2003-04 school year, when members reported that fees were being charged in 24 percent of schools.
The largest surge of charging fees in 2012-13 came at Class B schools, with 61 percent reporting fees after 54 percent reported using them in 2011-12. Class A schools saw a five percent jump to 71 percent, Class C saw a three percent rise to 49, and Class D schools saw a slight increase to 37 percent assessing fees.
Charging a standardized per-team fee for each on which a student participates remains the most popular method among schools that assess fees – although those doing so in that way dropped to 36 percent, a decrease of more than five percent. The median fee among those schools was $65, a decrease of $10 from the previous year.
Building on a trend that emerged during the 2011-12 survey, the use of fees incurred by students who paid once for an entire year of participation increased again to 29 percent of schools that charge. Families as a whole are facing higher fees as well; although an increasing number of schools are setting a maximum fee a family can be assessed, the amount of that fee increased in 2012-13 to a median of $300.
The survey for 2012-13 and surveys from previous years can be found on the MHSAA Website by clicking on Schools – Administrators – Pay-To-Play Resources.
The MHSAA is a private, not-for-profit corporation of voluntary membership by more than 1,500 public and private senior high schools and junior high/middle schools which exists to develop common rules for athletic eligibility and competition. No government funds or tax dollars support the MHSAA, which was the first such association nationally to not accept membership dues or tournament entry fees from schools. Member schools which enforce these rules are permitted to participate in MHSAA tournaments, which attract more than 1.4 million spectators each year.
25 Years Later, Scholar Athletes Shine On
By
Geoff Kimmerly
MHSAA.com senior editor
October 3, 2013
Jennifer Bissell and Scott Kieser had ideas how their futures might unfold when they stepped onto the Pontiac Silverdome turf to accept the inaugural Michigan High School Athletic Association Scholar-Athlete awards on Nov. 25, 1989.
Bissell’s bio in the MHSAA Football Finals program mentioned the Vestaburg senior planned to attend Grand Valley State University and study broadcasting and public relations. Kieser, a senior at Unionville-Sebewaing, was set to attend Michigan Tech University and major in secondary education.
Inevitably when high school students are deciding on careers, some of those plans changed.
 Kieser’s didn’t much; he did attend Michigan Tech, and after considering engineering during his first year stuck with education and is now a teacher and coach at Bay City Western High School. Bissell – now Dr. Jennifer Forrest – ended up with destinations different, nearby and then afar. She attended Central Michigan University on her way to becoming an orthopedic surgeon in Durango, Colo.
But the impact of high school sports – and what it meant to be named the MHSAA’s first Scholar Athletes – is not lost on either nearly a quarter century later.
“I vaguely remember ... watching the game from the booth, going out onto the field and the announcement,” Forrest recalled this week. “(But) I was very honored to get that award. It looked at both how well you did in school and participation in sports.”
“To walk on the field, shake Mr. (Jack) Roberts’ hand, see the award, it was a great honor,” Kieser said. “I was very lucky to have a lot of coaches in high school that inspired me and made me enjoy the learning in the classroom and all of the great life lessons I learned on the field, the basketball court and those arenas.”
The MHSAA has been fortunate as well to have Farm Bureau Insurance as its sponsor for all 24 years of the Scholar-Athlete Award. The program has evolved substantially from 1989-90 – when two students were recognized during the fall, winter and spring seasons – to this winter’s 25th celebration, during which Farm Bureau will award $1,000 scholarships to 32 student athletes based on their achievements both academic and athletic.
Each month building up to March's presentation, Second Half will catch up with some of the hundreds who have earned Scholar-Athlete Awards.
Now both 40 years old, the first winners certainly fit the bill. Forrest was a three-sport athlete participating in cross country, volleyball and softball and was president of Vestaburg’s student council. Kieser was co-captain of USA’s football and basketball teams, vice-president of his school’s student council and a member of the Tuscola County Leadership Forum.
And they’ve made good on the promise they showed and the awards they received as their futures lay ahead of them that Thanksgiving weekend.
Lists of exceptional accomplishments
The record board at Vestaburg High School still lists “J. Bissell” for fastest 5K time – at least one sign that Forrest’s legacy lives on in her little hometown.
One of her two older siblings still live there, her sister-in-law is a teacher at the high school and her niece Jaycee cracks up when people occasionally think the name on the leaderboard is hers.
 During her days walking those same school halls, Forrest never pictured herself in an operating room. In fact, she never wanted to picture the possibility.
Forrest babysat for a doctor while in high school and decided she wanted no part of the doctor lifestyle with its unpredictable schedule and 80-hour work weeks. But she was interested in physical therapy, and despite her early leanings toward studying communications settled on CMU and its sports medicine program.
She spent three hours in the CMU training room most afternoons her freshman year, helping with the gymnastics and track and field teams among others. As a sophomore she worked in a physical therapy office, which she found to be a little monotonous – and so she started considering that occupation she figured was out of the question only a few years before.
Forrest did end up in medical school, at Wayne State University, but figured she’d become an emergency room doctor and definitely never a surgeon. And then she changed her mind on that one too – Forrest ended up going into orthopedic surgery, did a residency at University of California-Irvine, married another doctor from northern California and eventually ended up in Durango – a destination that seems meant to be for a family that loves biking and snow sports.
Each Memorial weekend Forrest races in the Iron Horse Bicycle Classic, which pits competitors against a steam engine traveling 50 miles (and climbing 5,500 feet) from Durango to Silverton.
“Partly because of my background in sports, I gravitated toward sports-related injuries,” Forrest said. “I enjoyed being in sports in high school, and I’m still a road cyclist, still into sports myself.”
Forrest’s bio now on the Animas Orthopedic Associates website lists her as practicing general orthopedics with special interests in arthritis management, joint replacement surgery, hand surgery, pediatric orthopedics and orthopedics trauma.
She and her husband have three daughters ages 6-9 who also are active athletically, and they make the trip back to Michigan at least once every few summers.
While her continued appearance on the Vestaburg record book surprised Forrest at first, her name also appears on another impressive list – among the CMU Admissions Office’s “notable CMU alumni” alongside CBS sportscaster Dick Enberg, various NFL and NBA players and the author of “Marley & Me.”
“I don’t think of myself as that,” Forrest said.
“I really liked science and medicine, and in the long run it all worked out fine.”
Back to school to make a difference
Kieser remembers being in sixth and seventh grade and dreaming of being on the varsity football and basketball teams. When he got his chance, he understood the importance of setting the right example for the younger hopefuls looking up to him.
He continued to do the same at Michigan Tech and has made guiding young athletes and students his life’s work at Bay City Western.
 Kieser was the starting quarterback at Michigan Tech in 1993 and 1995 (missing 1994 with a broken foot) and was ranked among the top 50 nationally in Division 2 for total offense per game and passing efficiency. He decided to go out for the basketball team as a junior and started as a senior while earning the team’s scholastic achievement award with a 3.65 grade-point average while studying mathematics.
He also received both teams’ sportsmanship award, and was recognized by Burger King during his senior year as a Burger King National Scholar Athlete Award winner (the announcement appeared during the broadcast of the University of Michigan/Notre Dame game that fall). Tech’s football program received $25,000 for that accomplishment, and a scholarship in Kieser’s name is given to this day to an incoming freshman football player.
“Now that I reflect on it, that honor I won in high school really motivated me to continue that through college,” he said.
And beyond. Kieser teaches calculus and geometry at Bay City Western and is the junior varsity football coach. He hired in at the school right out of college in 1996 both as a teacher and the boys basketball varsity coach, a post he manned for seven seasons. All told, he’s coached some sport – track and field, soccer, baseball, football, basketball – at the high school, middle school or youth levels every year since he graduated at Tech.
He did consider engineering and the heftier paycheck that likely would’ve followed. But, “as I got a little bit older, I realized ... you’re not working for money (as a teacher). You’re working to help kids become the best they can be. Playing sports in college helped me mature, and I wanted to help as many other kids as possible reach their potential.”
He tries to teach his players to have pride in doing things the right away, respecting their opponents and the officials even despite the heated situations that arise in every game – the lessons he learned growing up across Saginaw Bay.
“I feel like the luckiest person in the world teaching and coaching and being involved I athletics,” Kieser said, “trying to encourage more kids to get involved, go out for a sport, do the best they can in the classroom, being the best they can be.”
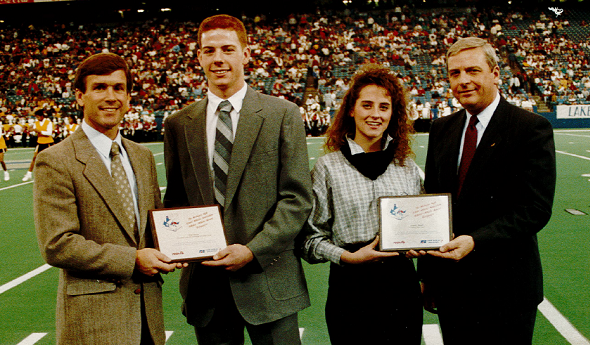
PHOTO: MHSAA Executive Director Jack Roberts (far left) presents Scott Kieser with his Scholar-Athlete Award in 1989 at the Pontiac Silverdome, while Jennifer Bissell receives hers from Larry Thomas, the then-executive vice president of Farm Bureau Insurance.