
Participation Rises to 4-Year High
July 10, 2018
By Geoff Kimmerly
Second Half editor
While enrollment in MHSAA member high schools saw another slight dip in 2017-18, participation in the 28 sports for which the MHSAA sponsors postseason tournaments rose to its highest point since 2013-14.
A total of 284,920 participants competed in MHSAA-sponsored sports this past school year, up 0.46 percent from 2016-17 – and despite a 1 percent drop in enrollment at member schools during that time. The overall MHSAA participation totals count students once for each sport in which they participate, meaning students who are multiple-sport athletes are counted more than once.
Girls participation rose for the third straight year to 121,349 participants, up 1.2 percent from 2016-17 and despite a 1.1 percent enrollment drop over the last year. Boys participation fell to 163,571 participants, a decrease of less than a tenth of a percent from the previous year – and much smaller than the boys enrollment decrease of nearly a full percent.
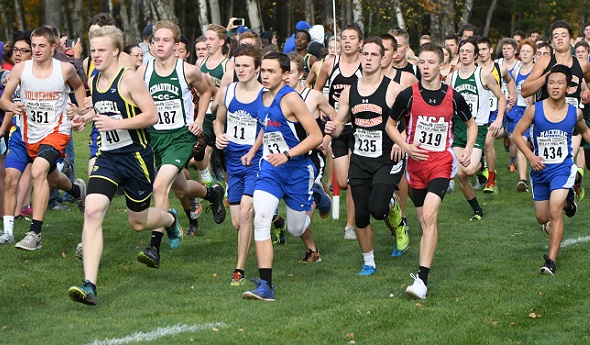
Girls lacrosse has set a participation record every season since becoming a sponsored tournament sport in 2005, and did so this spring with 2,900 participants – a 3.1 percent increase from a year ago. Boys lacrosse also set a record for the second year in a row, up 1.1 percent with 5,168 participants. Both boys and girls bowling broke records previously set in 2015-16 – boys bowling participation increased 8.4 percent over 2016-17 with 4,136 participants, while girls bowling was up 4.5 percent with 3,058 athletes. Also setting a record in 2017-18 was boys cross country, which saw record participation for the second straight season last fall with 9,656 runners (an increase of 2.6 percent).
The largest percentage increase in participation this school year came in girls gymnastics, which jumped 10.4 percent with 702 athletes – its most since 2011-12. Girls golf also enjoyed a notable increase, up 4.2 percent to 3,712 athletes – its highest participation total since 2007-08.
Six sports total saw increases in participation on both the girls and boys’ sides. In addition to bowling and lacrosse, girls cross country joined the record-setting boys with a 2.4 percent increase. Girls and boys swimming & diving both enjoyed increases for the second straight year, this time both by 2.4 percent. Girls tennis was up 2.3 percent to its highest total (9,123) since 2012-13, and boys tennis participation increased by one percent. Boys track & field (1.5 percent) increased for the third straight year, while girls track & field (1.6 percent) was up for the second consecutive.
Volleyball led participation among girls sports with 19,416 participants, up 1.8 percent from 2016-17. Other sports to see increases in 2017-18 were girls skiing, up 2.8 percent as participation increased for the second straight season; boys basketball, up a half percent; and girls soccer, which had four more athletes this spring than during the 2017 season.
Also of note in this year’s survey:
• The increase in participation for 18 sports during 2017-18 was compared to an increase in 16 sports for 2016-17 and 15 sports in 2015-16.
• Of 10 sports that saw decreases in participation in 2017-18, five were down less than a percent. Competitive cheer had five fewer athletes but 6,715 total, and there were three fewer boys golfers to take that total to 2,267. Boys skiing was down six athletes total to 831, while boys soccer was down 11 athletes and girls softball down 31 – both less than a quarter of a percent off their 2016-17 totals.
• Football experienced a much smaller decrease in participation last season than it had from 2015-16 to 2016-17, falling only 1.9 percent to 37,002 athletes – still the most participating in any sport by more than 13,000 athletes. The combined number of 11 and 8-player varsity teams sponsored by MHSAA schools last fall remained constant compared to recent seasons, although a shift of some programs from 11-player to 8-player continued.
The participation figures are gathered annually from MHSAA member schools to submit to the National Federation of State High School Associations for compiling of its national participation survey. Results of Michigan surveys from the 2000-01 school year to present may be viewed by clicking here.
The following chart shows participation figures for the 2017-18 school year from MHSAA member schools for sports in which the Association sponsors a postseason tournament:
|
BOYS |
GIRLS |
|||
|
Sport |
Schools (A) |
Participants |
Schools (A) |
Participants (B) |
|
Baseball |
642/655/5 |
17,668 |
- |
0/7 |
|
Basketball |
730/729/1 |
21,367 |
691/723 |
15,654/5 |
|
Bowling |
385/391/18 |
4,098 |
360/381 |
3,058/38 |
|
Competitive Cheer |
- |
- |
343/353 |
6,715 |
|
Cross Country |
640/651/4 |
9,650 |
620/650 |
8,696/6 |
|
Football - 11 player |
578/582/89 |
35,475 |
- |
0/108 |
|
8-player |
71/74/10 |
1,406 |
- |
0/13 |
|
Golf |
506/530/66 |
6,146 |
340/339 |
3,712/121 |
|
Gymnastics |
- |
- |
83/96 |
702 |
|
Ice Hockey |
240/269/9 |
3,353 |
- |
292/12 |
|
Lacrosse |
154/161/5 |
5,161 |
109/113 |
2,900/7 |
|
Skiing |
96/107/1 |
830 |
95/107 |
767/1 |
|
Soccer |
484/506/20 |
14,550 |
468/483 |
13,216/69 |
|
Softball |
- |
- |
624/643 |
13,610 |
|
Swimming & Diving |
246/274/14 |
5,020 |
261/280 |
5,732/78 |
|
Tennis |
295/309/12 |
6,134 |
332/340 |
9,123/31 |
|
Track & Field |
668/686/2 |
23,566 |
659/685 |
17,288/14 |
|
Volleyball |
- |
- |
715/717 |
19,416 |
|
Wrestling |
467/482/152 |
9,147 |
- |
126/250 |
(A) The first number is the number of schools reporting sponsorship on the Sports Participation Survey. The second number indicates schools sponsoring the sport including primary and secondary schools in cooperative programs as of May 14, 2018. The third number indicates the number of schools that had girls playing on teams consisting primarily of boys.
(B) The second number indicates the number of additional girls playing on teams consisting primarily of boys and entered in boys competition.
The MHSAA is a private, not-for-profit corporation of voluntary membership by more than 1,500 public and private senior high schools and junior high/middle schools which exists to develop common rules for athletic eligibility and competition. No government funds or tax dollars support the MHSAA, w

Parking, Entrance Protocols Announced For Ford Field
November 25, 2013
By Geoff Kimmerly
Second Half editor
To provide for the convenience and safety of spectators attending the Michigan High School Athletic Association Football Finals at Ford Field in Detroit, Nov. 29 and 30, attendees are being advised of a variety of items related to transportation and security – including new policies regulating types of bags that are allowed into the stadium.
In cooperation with Olympia Entertainment, more than 2,000 parking spaces will be available in close proximity to Ford Field and Comerica Park to the west, east and north of the ball parks. These parking lots will be clearly marked with Olympia Entertainment signs and will be charging $6. A map identifying the designated Olympia Entertainment lots can be found on the Football page of the MHSAA Website. (There also are a number of privately-operated parking facilities close to Ford Field, but their pricing may differ.)
Fans also are advised that tailgating, including the setting up and use of grilling equipment, and the consumption of alcohol, is prohibited by City of Detroit ordinances.
Gates A, B and G will be available for public entrance during the event. Ticket sales will begin near Gates A and G at 8 a.m. each day, and the building will open its doors to spectators at 9 a.m.
Tickets are priced at $10 and will allow a fan to see all four games in a single day. Spectators leaving the stadium will be required to purchase another ticket for re-entry. Children under the age of 2 will be admitted without charge for this event. There will not be a public Will Call window.
Upon arrival in the building, fans will find their designated seating areas on the South side of the field if their team is the designated home team for their contest and on the North side for the designated visiting team. Home teams this weekend are Clarkston, Muskegon, Zeeland West, Grand Rapids South Christian, Menominee, Ithaca, Ishpeming and Beal City. Brightly lit video boards above the seating areas will display the names of the participating teams each day, and fans should sit on the side of the stadium where they see their school’s name. For general fans, the entire lower bowl of Ford Field will be open for the event.
Security measures also will be in place to help assure spectator safety. Fans will be subject to a visual search, and Ford Field personnel reserve the right to request patrons open their coats, bags and other item-carrying vessels for visual inspection and deny entrance to individuals who do not cooperate. The NFL this season has enhanced its safety policy to further monitor what type of bags may be brought into stadiums. Those additions are noted in bold below.
Items which fans will be prohibited from bringing into the building include, but are not limited to, the following:
- Purses larger than a clutch bag, coolers, briefcases, backpacks, diaper bags, fanny packs, cinch bags, grocery & paper bags, duffle bags, luggage of any kind, computer bags and camera & binocular bags or cases. Visit www.nfl.com/allclear for additional details.
- Aerosol cans (hairspray, mace, pepper spray, etc.)
- Animals (except service animals to aid guests with disabilities)
- Balloons (air or helium)
- Balls (beach balls, footballs, etc.)
- Banners
- Cameras with lenses longer than five inches
- Decals, stickers, confetti or flitter
- Electronic equipment including laptop computers, large video recorders and video cameras, and tripods (hand-held video cameras are allowed)
- Fireworks
- Food, beverages or liquids (cans, bottles, boxes, flasks, etc.)
- Illegal substances
- Knives, pocket knives, box cutters, scissors, etc.
- Laser pointers
- Markers (permanent) and/or paint
- Noisemaking devices (bells, horns, kazoos, whistles, etc.)
- Objects that can be used as missiles or projectiles (sticks, bats, clubs, Frisbees, etc.)
- Seat cushions
- Strollers and infant car seats or carriers
- Umbrellas
- Weapons
The following items will be permitted after inspection:
- Bags that are clear plastic, vinyl or PVC and do not exceed 12 inches by 6 inches by 12 inches
- One-gallon clear plastic freezer bags (Ziploc bag or similar)
- Small clutch bags, approximately the size of a hand, with or without a handle or strap. For details, visit www.nfl.com/allclear. An exception will be made for medically necessary items after proper inspection at a gate designated for this purpose.
- Small radios (no larger than the size of a football and used with an earpiece).
- Small hand-held video cameras (but no tripods or extension cords).
- Binoculars (but no cases).
The complete list of prohibited items can be found on the Ford Field Website under Policies & Info. Prohibited items that are discovered during security inspections at stadium entrances must either be returned to the owner's vehicle or discarded. Items will not be held for later pickup.
Fans are reminded that all image taking (still and video) may be only for personal, non-commercial use.
The MHSAA is a private, not-for-profit corporation of voluntary membership by more than 1,500 public and private senior high schools and junior high/middle schools which exists to develop common rules for athletic eligibility and competition. No government funds or tax dollars support the MHSAA, which was the first such association nationally to not accept membership dues or tournament entry fees from schools. Member schools which enforce these rules are permitted to participate in MHSAA tournaments, which attract more than 1.4 million spectators each year.