
Participation Stays Above Enrollment Dip
July 13, 2017
By Geoff Kimmerly
Second Half editor
Enrollment in Michigan High School Athletic Association member high schools continued a trend of slight declines in 2016-17, but participation in sports held firm as records were set in three of the 28 sports for which postseason tournaments are sponsored by the MHSAA.
A total of 283,625 participants competed in MHSAA-sponsored sports this past school year, down 0.21 percent from 2015-16. However, this year’s decrease falls in line with a decrease in enrollment at member schools of 0.40 percent. The overall MHSAA participation totals count students once for each sport in which they participate, meaning students who are multiple-sport athletes are counted more than once.
Despite a drop in girls enrollment of 0.60 percent in 2016-17, girls participation increased for the second straight school year to 119,937 participants, an increase of 0.55 percent. Boys overall participation fell 0.76 percent to 163,688 participants, slightly sharper than the drop in boys enrollment of 0.21 percent for the school year. However, eight girls sports and eight boys sports saw increases in participation in 2016-17.
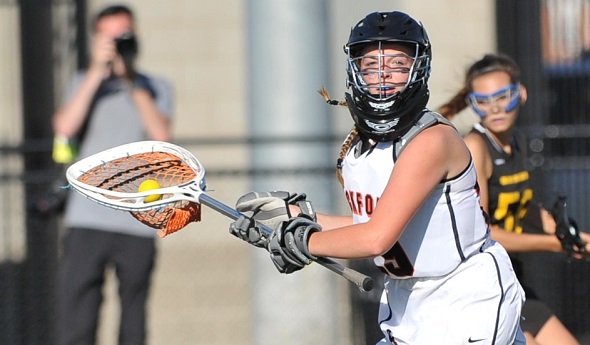
Boys and girls lacrosse continued their record-setting climb, boys lacrosse with 5,114 participants to increase 3.3 percent from 2015-16 and break its record set in 2013-14. Girls lacrosse saw 2,814 participants, an increase of 1.4 percent from the previous year, to continue its streak of setting a participation record every season since becoming a sponsored tournament sport in 2005. Boys cross country also set a record for the second straight season, this time with an increase of 1.7 percent to 9,415 participants total.
Good news also came from girls basketball, which ended a string of 10 straight declines in participation with an increase of 2.2 percent in 2016-17 – those 15,896 participants were the most in the sport since 2013-14. The largest percentage increases by far in 2016-17 were seen in boys and girls skiing, which were up 16.4 and 14.4 percent, respectively, with 837 boys participants and 746 girls after both experienced decreases in participation the school year before.
A number of other sports also saw increases on both the boys and girls’ sides: swimming & diving saw a 5.2 percent increase for boys and 4.1 increase for girls, track & field saw a 2.4 percent increase for girls and 1.9 percent increase for boys, girls cross country joined its boys counterpart with a 1.0 percent increase in participation, and tennis saw a 2.8 percent increase for girls and 0.48 increase for boys. That boys tennis increase ended a string of seven straight years of declining participation.
Other sports to see increases in 2016-17 were girls golf, increasing for the second straight season, this time 2.9 percent to 3,561 participants; boys ice hockey, up 1.8 percent to 3,411 participants; and boys soccer up 0.38 percent to 14,630 participants.
Also of note in this year’s survey:
• The increase in participation for 16 sports during 2016-17 was compared to an increase in 15 sports for 2015-16 and only eight sports in 2014-15.
• After a significant slowing in participation decline in football over the previous three years, 2016-17 saw a decline of 4.6 percent, or 1,805 participants from 2015-16. The number of school-sponsored football programs remained consistent over the last two years – there were 642 in 2015-16 and 640 in 2016-17 (up from 630 in 2014-15). But there was a shift of programs from 11-player to 8-player; there were 15 fewer 11-player programs in 2016-17 than the year before, but 13 more 8-player programs.
• Of the 12 MHSAA sports that saw participation declines in 2016-17, three were by mere hundredths of a percent. Boys wrestling saw a decline of three participants total, girls gymnastics had two fewer participants and boys golf participation decreased by one person.
The participation figures are gathered annually from MHSAA member schools to submit to the National Federation of State High School Associations for compiling of its national participation survey. Results of Michigan surveys from the 2000-01 school year to present may be viewed by clicking here.
The following chart shows participation figures for the 2016-17 school year from MHSAA member schools for sports in which the Association sponsors a postseason tournament:
|
BOYS |
GIRLS |
|||
SPORT |
SCHOOLS (A) |
PARTICIPANTS |
SCHOOLS (A) |
PARTICIPANTS (B) |
|
Baseball |
635/656/6 |
17,989 |
- |
0/9 |
|
Basketball |
722/735/1 |
21,263 |
690/725 |
15,896/4 |
|
Bowling |
363/381/10 |
3,792 |
341/369 |
2,926/24 |
|
Competitive Cheer |
- |
- |
334/349 |
6,720 |
|
Cross Country |
618/649/0 |
9,415 |
609/646 |
8,489 |
|
Football - 11 player |
580/592/87 |
36,460 |
- |
0/111 |
|
- 8-player |
60/61/11 |
1,130 |
- |
14 |
|
Golf |
496/526/59 |
6,170 |
329/342 |
3,561/100 |
|
Gymnastics |
- |
- |
72/88 |
636 |
|
Ice Hockey |
233/257/14 |
3,397 |
|
0/14 |
|
Lacrosse |
147/153/3 |
5,110 |
107/107 |
2,814/4 |
|
Skiing |
92/102/3 |
830 |
89/103 |
746/7 |
|
Soccer |
481/499/23 |
14,541 |
459/483 |
13,212/89 |
|
Softball |
- |
- |
616/646 |
13,641 |
|
Swimming & Diving |
243/274/12 |
4,919 |
256/283 |
5,600/60 |
|
Tennis |
293/309/9 |
6,085 |
327/341 |
8,920/21 |
|
Track & Field |
655/683/0 |
23,232 |
648/681 |
17,009/0 |
|
Volleyball |
- |
- |
704/720 |
19,067 |
|
Wrestling |
459/483/159 |
9,355 |
- |
0/2 |
(A) The first number is the number of schools reporting sponsorship on the Sports Participation Survey. The second number indicates schools sponsoring the sport including primary and secondary schools in cooperative programs as of May 22, 2017. The third number indicates the number of schools that had girls playing on teams consisting primarily of boys.
(B) The second number indicates the number of additional g
Gordon to Receive MHSAA Hampton Award for Championing Unified Sports
By
Geoff Kimmerly
MHSAA.com senior editor
February 11, 2026
As athletic director at Novi High School a decade ago, Brian Gordon helped Michigan become a national leader in growing Special Olympics Unified Sports for students with intellectual disabilities. Nearly three years after retiring from school administration, he remains an impassioned advocate helping schools all over the state add these inclusive programs to their athletic offerings.
To recognize his pioneering and now continuing work in expanding these opportunities across the state, Gordon has been selected as the recipient of this year’s Nate Hampton Champion of Progress in Athletics Award by the Michigan High School Athletic Association.
The Hampton Award was created by the MHSAA’s Representative Council to honor Nate Hampton, who retired in 2021 after serving in education and educational athletics for 50 years, including the last 32 as an MHSAA assistant director. Honorees have championed the promotion and advancement of opportunities for women, minorities and other underrepresented groups within interscholastic athletics, while serving as an administrator, coach, official, educator or school sports leader in Michigan.
 Gordon will receive the Hampton Award during the Michigan Interscholastic Athletic Administrators Association (MIAAA) annual conference, March 13-16 in Traverse City.
“To me, (Unified Sports) is absolutely the purest form of sport – what you’re supposed to get out of participating in athletics. Kids that participate in this program get every bit of that – teamwork, camaraderie, adversity, how to win, how to lose, being part of something bigger than yourself. It was, to me, just so impactful,” Gordon said. “The whole idea of more kids being involved in their athletic program, where they have the opportunity to play in front of their parents, being members of an athletic department at their school, to me was just incredible. … And the life lessons that kids learn, families learn, you can’t even measure them.
“It’s just a great, positive experience – for everyone.”
Gordon began his professional career in educational athletics in 1990 as a physical education and health teacher for Royal Oak Schools, and moved into his first athletic director/assistant principal role at Royal Oak in 2010. He left to become the director of athletic and physical education at Novi High School in 2012, retired from Novi at the end of the 2020-21 school year but then returned to Royal Oak as athletic director the following fall for two more years.
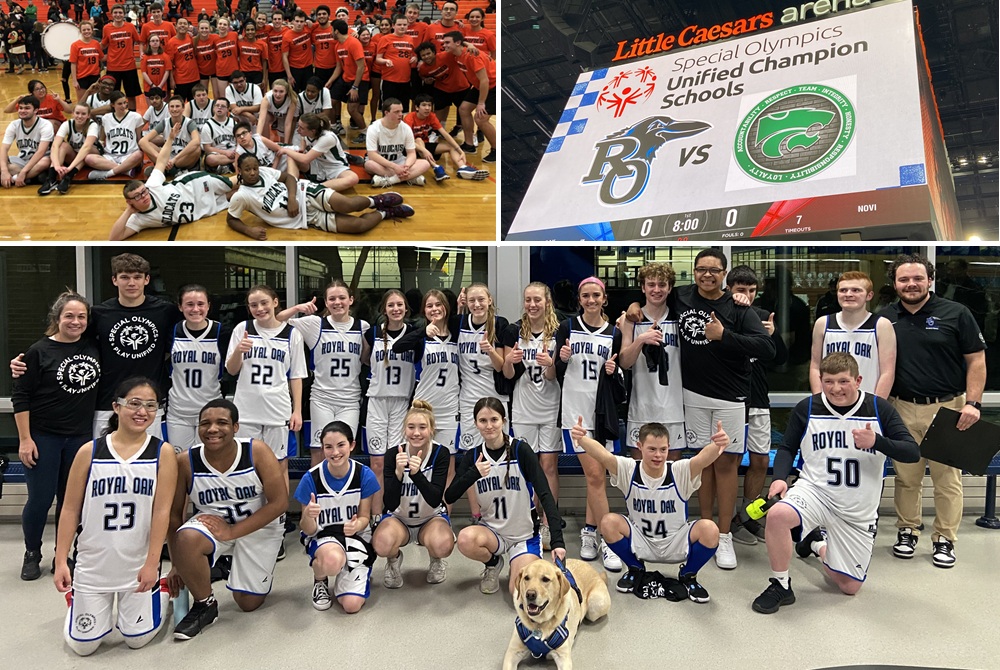
Unified Sports pair students with and without intellectual disabilities as teammates for training and competition. While at Novi, Gordon and Brighton athletic director John Thompson were inspired to bring Unified Sports not only to their schools, but to the Kensington Lakes Activities Association as a whole – and during the 2015-16 school year their schools were joined by Northville, Howell and Hartland in offering Unified teams, with the total soon growing to 13 KLAA schools. The KLAA, at Novi, hosted the first league tournament in the nation for Unified Sports teams – playing 21 basketball games during the inaugural event.
Also following his Novi retirement in 2021, Gordon became a liaison for Special Olympics of Michigan and Unified Sports. He meets with school administrators to promote Unified Sports and help districts build programs, and estimates there are more than 600 elementary, middle and high school Unified Sports teams across the state – with more than 100 high schools playing as part of leagues.
Current Unified offerings in Michigan include basketball, soccer and bocce, with track & field to be introduced this spring. Unified athletes have opportunities to play not just as part of leagues, but during special events like school-day assembly games and at venues like Little Caesars Arena in Detroit.
“Brian Gordon has spent more than 35 years promoting school sports and the athletes they serve, and who better to advocate for Unified Sports than someone who has dedicated his career to championing kids and creating opportunities for them to excel,” MHSAA Executive Director Mark Uyl said. “The MHSAA and the state’s school sports community have long benefitted from Brian’s positive approach and tremendous energy, and he’s poured all of himself into building bridges for Unified Sports in communities all over Michigan.”
In addition to his Special Olympics efforts, Gordon has served as a mentor for the MHSAA’s AD Connection Program since its creation at the start of the 2023-24 school year, working with first-year athletic directors as they transition to that role.
He’s also taught at the elementary and middle school levels, and supervised physical education and served as a health advisory chairperson at the district level. Including a season while still a college student, he has coached baseball, football, basketball and track & field from the junior high to varsity levels, including a stint as Royal Oak Kimball and Royal Oak High varsity baseball coach from 1995-2010. He was inducted into the Michigan High School Baseball Coaches Association Hall of Fame in 2011 and the Michigan High School Coaches Association Hall of Fame in 2021.
Gordon was selected for the MIAAA’s Jack Johnson Distinguished Service Award in 2021 and received an MHSAA Allen W. Bush Award in 2019 for his essential but often “behind-the-scenes” contributions to school sports. Previously, Gordon also was named Oakland County Athletic Director of the Year for 2018-19 by the Oakland County Athletic Directors Association, served as the OCADA president in 2014-15 and on its board from 2010-16, and also served as vice president of the Kensington Lakes Activities Association and president of the Kensington Conference. He has been a member of the MIAAA since 2008 and National Interscholastic Athletic Administrators Association (NIAAA) since 2010, and was named a Regional Athletic Director of the Year by the MIAAA in 2018.
“Being a recipient of the Nate Hampton Award – Nate has made such a difference in educational athletics in our state for so long, that it’s truly an honor to represent him in this award,” Gordon said. “I’m really proud of the fact that we’ve been able to make a difference in the state, just like he did, with Unified Sports.”
Gordon graduated from Clawson High School in 1985 and earned his bachelor’s degree at Central Michigan University – where he also played baseball – and master’s in sports administration and school leadership from Wayne State University. He earned his certified athletic administrator (CAA) designation from the NIAAA.
Prioritizing education and students has been a family focus for the Gordons; Brian’s wife Jill Gordon also is a retired teacher. They have two children – daughter McKenzie Ribbing and son Zachary Gordon, and retirement has allowed for more time with both as well as son-in-law Mike Ribbing and granddaughter Isabel.
The first Nate Hampton Champion of Progress in Athletics Award was presented in 2024.
Past recipients
2024 – Nicole Carter, Novi
2025 – Arnetta Thompson, Wyoming
(Photos courtesy of Brian Gordon.)