

Spring Preliminary Concussion Data Announced
June 28, 2016
By Geoff Kimmerly
Second Half editor
Similar to information gathered after the first two seasons of the 2015-16 school year, the Michigan High School Athletic Association has found through collection of preliminary data that fewer than one percent of its more than 100,000 spring student-athletes experienced potential concussions during the season that concluded early this month.
The MHSAA this school year requested for the first time that member schools report possible concussions by their student-athletes during both practice and competition. As expected, the overall percentage of spring student-athletes with potential concussions was lower than for both fall and winter – as many spring sports involve only limited contact. A first set of preliminary data announced in December showed only two percent of more than 100,000 high school fall athletes experienced concussions during that first season of 2015-16. Preliminary data released in May for the winter also showed two percent of that season’s more than 70,000 student-athletes had experienced potential concussions as well.
As it did for the fall and winter, the MHSAA again received data from more than 99 percent of its member high schools at the end of the spring season. The average number of possible spring concussions reported by member high schools through June 27, 2016, was 1.0 concussion per school – fewer than the averages per school reported for the fall (3.2) and winter (1.6) seasons. Just under 50 percent of reporting schools stated they had no concussions by athletes this spring.
However, six spring sports — including girls track & field — registered at least 20 possible concussions, and for the second consecutive season a girls sport reported the highest percentage. Following girls basketball in the winter, girls soccer revealed 53 percent of possible concussions reported this spring – despite only 12 percent of spring student-athletes participating in that sport. Softball, also with roughly 12 percent of spring student-athletes, followed with 19 percent of possible concussions reported. Boys lacrosse, with 11 percent of possible concussions, ranked third-highest overall and highest among boys sports this spring. Roughly five percent of spring student-athletes play boys lacrosse.
Girls soccer has produced 58 percent more potential concussions than boys soccer did during the fall, despite seven percent fewer student-athletes playing girls soccer. Boys lacrosse, meanwhile, had nearly three times as many possible concussions as girls lacrosse – with only 48 percent more participants.
Schools also are required to designate if potential concussions occurred during competition or practice and at which level – varsity, junior varsity or freshman – and this spring those designations provided additional compelling data. In girls lacrosse, 63 percent of possible concussions occurred at the varsity level, while softball saw its most at the junior varsity level and baseball saw as many at the varsity level as the junior varsity and freshman levels combined.
“The preliminary data we were able to collect this spring again shows, and especially with girls soccer, why we must work for solutions to limit head injuries in all sports and not focus solely on sports that are most publicized,” MHSAA Executive Director John E. “Jack” Roberts said. “As we now move toward solidifying our research from this school year, we expect to learn even more about which factors contribute most to the sustaining of concussions at the high school level, and what our administrators, coaches, rule-makers and others might be able to do to make our games even safer and healthier for our student-athletes.”
Data collected by the MHSAA remains preliminary, in part, because results noted include pending reports that have not been verified. After completion of these follow-up reports, the final number of concussions that actually occurred this past season and during the fall and winter may be lower than the preliminary numbers being reported at this time.
The data analyzed to date is for high schools only, although middle schools also have the opportunity to report possible concussions. A full breakdown of the data including concussions by gender, sport, team level (varsity through junior high) and setting (practice or event) will be reported at the end of this summer.
The reporting of possible concussions is part of a three-pronged advance by the MHSAA in concussion care begun during the 2015-16 school year which is producing data related to the frequency and severity of head injuries. The MHSAA in fall 2015 launched the largest ever state high school association sideline concussion testing pilot program, with 62 schools taking part by using one of two screening tests designed to detect concussions. One of the objectives of the pilot was to increase awareness of concussions and improve sideline detection; and preliminary results have indicated that the average number of possible concussions reported by pilot schools exceeds the average reported by schools outside the pilot group.
Of 15 schools reporting the most possible concussions this spring, six are part of the MHSAA’s pilot sideline detection programs. Those programs – King-Devick Test and XLNTbrain Sport – utilize technology to provide on-site testing of athletes who have sustained possible concussions, with results of those examinations then compared against baseline tests taken by athletes previously. Schools participating in the pilot programs for the 2016-17 school year received training at the MHSAA office in East Lansing on June 16 and 17.
The MHSAA also is the first state association to provide all participants at every member high school and junior high/middle school with insurance intended to pay accident medical expense benefits – covering deductibles and co-pays left unpaid by other policies – resulting from head injuries sustained during school practices or competitions and at no cost to either schools or families. The program has produced additional data about the frequency and severity of head injuries. As of June 27, only 144 claims had been made on the insurance policy designed to assist in payment for concussion care. Fifty-one of the claims are for football, 39 are for basketball (girls and boys combined) and 14 are for boys soccer.
Schools report possible concussions online via the MHSAA Website. Reports are then examined by members of the MHSAA staff, who follow up with school administrators as those student-athletes continue to receive care and eventually return to play. Student privacy is protected.
Previously, the MHSAA also was among the first state associations to adopt a return-to-play protocol that keeps an athlete out of activity until at least the next day after a suspected concussion, and allows that athlete to return to play only after he or she has been cleared for activity by a doctor (M.D. or D.O.), physician’s assistant or nurse practitioner. The follow-up reports schools are providing the MHSAA reveal that the majority of students are being withheld from activity for a week or longer following the reported concussion. This will be discussed in more detail when the MHSAA releases a more comprehensive review that covers the entire school year.
The MHSAA is a private, not-for-profit corporation of voluntary membership by more than 1,400 public and private senior high schools and junior high/middle schools which exists to develop common rules for athletic eligibility and competition. No government funds or tax dollars support the MHSAA, which was the first such association nationally to not accept membership dues or tournament entry fees from schools. Member schools which enforce these rules are permitted to participate in MHSAA tournaments, which attract more than 1.4 million spectators each year.
-0-
Rep Council Wrap-up: Fall 2012
December 7, 2012
A change in format for the Boys Basketball Finals highlighted actions taken by the Representative Council of the Michigan High School Athletic Association during its annual Fall Meeting, Nov. 30 in East Lansing.
Mirroring closely the format of the MHSAA Girls Basketball Finals, the Boys Finals will move this season from three to two sessions. The first session will tip off with the Class D Final at 10 a.m., followed by the Class A championship game. The second session will begin tentatively at 4:30 p.m. with the Class C Final and conclude with the Class B title game.
Previously, the Class A and B Finals were separate sessions, with the Class A Final tipping at 4 p.m. and Class B at 8 p.m. The change will make for a shorter day for spectators wishing to attend all four games, and also allow them to do so by purchasing tickets for two sessions instead of three.
 The Fall Meeting also saw the addition of two members to the 19-person council. Reese Public Schools athletic director Dave Derocher began a two-year term after being elected earlier this fall to represent Class C and D schools in the northern Lower Peninsula. Orlando Medina, who serves as athletic coordinator for Harrison Township L’Anse Creuse Public Schools, was appointed for a two-year term. He also previously served as athletic director at Detroit Cesar Chavez Academy. They fill positions formerly held by Beal City superintendent William Chilman IV and Romulus High School athletic director Mark Woodson, whose terms ended.
Also, Carmen Kennedy, principal at St. Clair Shores South Lake High School, was reappointed for a second two-year term. The Representative Council is the legislative body of the MHSAA. All but five members are elected by member schools. Four members are appointed by the Council to facilitate representation of females and minorities, and the 19th position is occupied by the Superintendent of Public Instruction or designee.
The most prominent points discussed at the Fall Meeting were risk minimization for athletes and possible strategies for making school sports safer. Among topics discussed were raising expectations for coaches’ participation in online safety courses and schools’ management of heat illness; the possible restructuring of practice policies in regards to hot weather; and game rules revisions to enhance safety especially in football, soccer and ice hockey.
The Council reviewed its previous actions on those topics, including discussions in December 2011 that led to the inclusion of health and safety content in online rules meetings. Council members considered a model policy for managing heat and humidity, and also a number of ideas collected during Fall Update meetings with administrators throughout the state.
No action was requested on those items at the Fall Meeting. Complete and vetted proposals are likely to be considered when the Council next meets in March and then May.
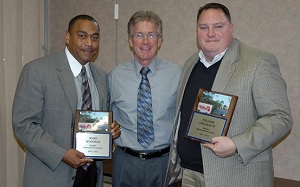
PHOTO: Outgoing Representative Council members Mark Woodson of Romulus (left) and William Chilman IV (right) are presented plaques for their service by MHSAA Executive Director Jack Roberts (middle) during the Fall Meeting.