

2015 Week 7 Football Playoff Listing
October 6, 2015
By Geoff Kimmerly
Second Half editor
Here is a list of Michigan High School Athletic Association football playing schools, displaying their win-loss records and playoff averages through the sixth week of the season.
Schools on this list are in enrollment order for 11-player teams, with 8-player teams ordered by playoff average. An asterisk (*) beside a record indicates a team has eight or fewer games scheduled. A caret (^) beside a school’s name indicates a team is one win away from playoff qualification.
Those schools with 11-player teams with six or more wins playing nine-game schedules, or five or more wins playing eight games or fewer, will qualify for the MHSAA Football Playoffs beginning Oct. 30. Schools with 5-4, 4-3 or 4-4 records may qualify if the number of potential qualifiers by win total does not reach the 256 mark. Schools with six or more wins playing nine-game schedules or five or more wins playing eight games or fewer may be subtracted from the field based on playoff average if the number of potential qualifiers exceeds the 256 mark.
Once the 256 qualifying schools are determined, they will be divided by enrollment groups into eight equal divisions of 32 schools, and then drawn into regions of eight teams each and districts of four teams each. Those schools with 8-player teams will be ranked by playoff average at season’s end, and the top 16 programs will be drawn into regions of eight teams each for the playoff in that division, which also begins Oct. 30.
To review a list of all football playoff schools, individual school playoff point details and to report errors, visit the Football page of the MHSAA Website.
The announcement of the qualifiers and first-round pairings for both the 11 and 8-player playoffs will take place at 7 p.m. Oct. 25 on the Selection Sunday Show on FOX Sports Detroit. The playoff qualifiers and pairings will be posted to the MHSAA Website following the Selection Sunday Show.
11-Player Playoff Listing
1. Macomb Dakota, 2921, 4-2, 72.167
2. Grand Blanc, 2727, 4-2, 64.667
3. Clarkston, 2707, 4-2, 66.667
4. Utica Eisenhower, 2669, 3-3, 56.333
5. Sterling Heights Stevenson ^, 2634, 5-1, 82.000
6. Clinton Township Chippewa Valley ^, 2611, 5-1, 92.500
7. East Kentwood, 2581, 4-2, 69.000
8. Howell ^, 2567, 5-1, 77.833
9. Rockford, 2561, 4-2, 69.667
10. Dearborn Fordson, 2477, 3-3, 47.000
11. Detroit Cass Tech ^, 2285, 5-1, 84.833
12. Northville, 2281, 6-0, 97.333
13. Brighton ^, 2211, 5-1, 50.000
14. Troy Athens, 2153, 3-3, 48.333
15. Detroit Catholic Central ^, 2138, 5-1, 74.100
16. Utica Ford, 2080, 4-2, 70.833
17. Canton ^, 2076, 5-1, 80.500
18. Monroe, 2066, 3-3, 49.500
19. Salem, 2063, 3-3, 51.333
20. Lapeer, 2059, 6-0, 88.000
21. Plymouth ^, 2057, 5-1, 77.667
22. Ann Arbor Pioneer ^, 2025, 5-1, 80.833
23. Hartland, 2017, 4-2, 66.667
24. Novi, 2017, 3-3, 48.333
25. Macomb L'Anse Creuse North, 2001, 3-3, 51.000
26. New Baltimore Anchor Bay, 1946, 3-3, 48.833
27. West Bloomfield, 1932, 6-0, 97.333
28. Dearborn, 1921, 3-3, 47.333
29. Saline *, 1879, 6-0, 96.000
30. Livonia Stevenson ^, 1831, 5-1, 83.500
31. Grandville, 1825, 3-3, 47.000
32. Warren Mott ^, 1810, 5-1, 84.667
33. Holt, 1788, 4-2, 59.833
34. Utica, 1788, 3-3, 52.667
35. Davison, 1765, 4-2, 60.833
36. Hudsonville ^, 1763, 5-1, 88.333
37. Belleville ^, 1735, 5-1, 81.667
38. Ann Arbor Skyline, 1703, 3-3, 41.333
39. Romeo, 1673, 6-0, 104.000
40. Grand Ledge, 1663, 6-0, 89.333
41. Rochester Hills Stoney Creek, 1654, 3-3, 44.833
42. Waterford Mott, 1651, 3-3, 45.500
43. Grosse Pointe South, 1629, 4-2, 66.500
44. Livonia Churchill, 1620, 4-2, 61.333
45. Livonia Franklin, 1615, 3-3, 42.000
46. Walled Lake Northern, 1611, 4-2, 65.500
47. Warren DeLaSalle ^, 1572, 5-1, 83.500
48. Sterling Heights ^, 1561, 5-1, 72.500
49. Detroit Martin Luther King, 1537, 6-0, 104.000
50. Flint Carman-Ainsworth, 1533, 3-3, 44.500
51. Oak Park, 1530, 3-3, 48.667
52. Warren Cousino, 1514, 4-2, 61.000
53. Waterford Kettering, 1512, 3-3, 46.833
54. Detroit U-D Jesuit, 1486, 4-2, 58.933
55. Traverse City Central, 1474, 6-0, 100.000
56. Walled Lake Western, 1462, 6-0, 106.667
57. Midland, 1419, 6-0, 93.333
58. Jenison, 1418, 3-3, 51.833
59. Dearborn Edsel Ford, 1380, 3-3, 42.667
60. Portage Northern, 1375, 3-3, 45.667
61. Lincoln Park, 1363, 4-2, 63.500
62. Portage Central, 1351, 6-0, 97.333
63. Wyandotte Roosevelt ^, 1346, 5-1, 81.833
64. Battle Creek Lakeview, 1344, 4-2, 66.500
65. Grosse Pointe North, 1341, 3-3, 45.333
66. Detroit East English, 1338, 4-2, 61.500
67. Swartz Creek, 1322, 3-3, 50.167
68. Southfield-Lathrup, 1320, 4-2, 55.833
69. Dearborn Heights Crestwood, 1308, 3-3, 37.167
70. Alpena, 1285, 3-3, 35.767
71. Grand Rapids Ottawa Hills, 1280, 4-2, 58.167
72. Southfield, 1269, 4-2, 69.333
73. North Farmington, 1267, 3-3, 46.333
74. Port Huron Northern, 1260, 4-2, 56.500
75. Midland Dow ^, 1256, 5-1, 75.167
76. Berkley ^, 1248, 5-1, 71.167
77. Birmingham Groves, 1248, 6-0, 88.000
78. Royal Oak, 1248, 3-3, 45.333
79. Jackson, 1244, 4-2, 55.833
80. Flushing, 1242, 3-3, 48.167
81. Muskegon Mona Shores, 1239, 6-0, 100.000
82. Muskegon Reeths-Puffer, 1222, 3-3, 41.667
83. Farmington Hills Harrison ^, 1218, 5-1, 81.833
84. Grand Rapids Northview, 1183, 3-3, 46.000
85. Farmington, 1176, 4-2, 64.833
86. Mattawan, 1175, 3-3, 47.000
87. Lowell ^, 1168, 5-1, 86.167
88. Gibraltar Carlson, 1140, 4-2, 61.333
89. Grand Rapids Forest Hills Northern ^, 1124, 5-1, 81.833
90. East Lansing, 1123, 3-3, 49.667
91. Battle Creek Central, 1115, 3-3, 50.833
92. Muskegon ^, 1113, 5-1, 90.000
93. Fenton ^, 1108, 5-1, 81.833
94. Ypsilanti Community, 1088, 3-3, 42.667
95. Byron Center ^, 1070, 5-1, 75.333
96. Holly, 1068, 4-2, 69.167
97. Redford Thurston, 1064, 3-3, 52.667
98. Mt. Pleasant, 1061, 4-2, 63.000
99. Ortonville-Brandon, 1060, 3-3, 47.000
100. Allen Park ^, 1058, 5-1, 86.000
101. St. Johns ^, 1053, 5-1, 83.333
102. Zeeland East, 1040, 3-3, 59.333
103. Mason, 1033, 4-2, 61.500
104. Orchard Lake St. Mary's *, 1032, 5-1, 83.524
105. Grand Rapids Kenowa Hills, 1030, 3-3, 48.167
106. Hamtramck, 984, 4-2, 48.333
107. St. Joseph ^, 980, 5-1, 80.500
108. East Grand Rapids, 975, 4-2, 70.500
109. Petoskey, 970, 4-2, 57.267
110. DeWitt, 960, 6-0, 101.333
111. Romulus, 956, 4-2, 63.833
112. Trenton ^, 953, 5-1, 78.000
113. Linden ^, 947, 5-1, 86.167
114. Cedar Springs, 943, 4-2, 60.000
115. Gaylord ^, 940, 5-1, 65.100
116. Sturgis ^, 926, 5-1, 66.833
117. Riverview, 912, 4-2, 49.500
118. Grand Rapids Christian, 905, 4-2, 65.333
119. Parma Western, 876, 4-2, 56.167
120. Haslett, 875, 3-3, 50.000
121. Stevensville Lakeshore, 874, 4-2, 70.667
122. Warren Fitzgerald, 871, 3-3, 40.667
123. Fruitport, 865, 3-3, 38.933
124. Coldwater, 863, 6-0, 92.000
125. Marshall ^, 863, 5-1, 79.500
126. Vicksburg, 858, 4-2, 54.833
127. Edwardsburg, 851, 6-0, 81.333
128. Sault Ste. Marie, 850, 4-2, 67.400
129. Bay City John Glenn, 847, 4-2, 49.600
130. Chelsea, 845, 6-0, 82.667
131. Tecumseh, 844, 3-3, 45.000
132. Zeeland West, 840, 6-0, 89.333
133. Detroit Mumford, 837, 3-3, 46.667
134. Ada Forest Hills Eastern, 828, 6-0, 86.667
135. Dearborn Divine Child, 827, 3-3, 44.500
136. Milan ^, 820, 5-1, 72.667
137. Battle Creek Harper Creek, 816, 3-3, 41.167
138. Plainwell, 807, 4-2, 52.833
139. Fowlerville, 800, 3-3, 44.833
140. Bloomfield Hills Cranbrook Kingswood, 794, 6-0, 72.000
141. Spring Lake, 794, 3-3, 39.767
142. Detroit Denby, 790, 3-3, 47.000
143. Marysville, 783, 4-2, 62.333
144. Holland Christian, 759, 3-3, 40.833
145. North Branch, 758, 3-3, 40.000
146. Goodrich, 754, 4-2, 55.667
147. Pontiac Notre Dame Prep, 728, 5-1, 79.167
148. Allendale, 720, 3-3, 39.000
149. Detroit Douglass, 718, 3-3, 37.667
150. Warren Lincoln, 697, 3-3, 41.500
151. Harper Woods Chandler Park Academy, 692, 4-2, 53.433
152. Detroit Country Day ^, 685, 5-1, 71.167
153. Comstock Park ^, 682, 5-1, 75.500
154. Detroit Cesar Chavez Academy, 681, 4-2, 40.167
155. Croswell-Lexington, 668, 4-2, 46.833
156. St. Clair Shores South Lake, 668, 6-0, 84.000
157. Hudsonville Unity Christian, 665, 4-2, 49.167
158. Grand Rapids Catholic Central ^, 658, 5-1, 77.833
159. Williamston, 657, 4-2, 58.333
160. Corunna ^, 656, 5-1, 69.833
161. Whitehall, 656, 3-3, 42.333
162. Paw Paw, 653, 3-3, 43.000
163. Alma, 642, 3-3, 41.833
164. Wyoming Kelloggsville, 640, 3-3, 33.667
165. Detroit Collegiate Prep, 632, 6-0, 82.667
166. Benton Harbor, 631, 3-3, 51.000
167. Lake Fenton, 625, 4-2, 53.500
168. Lake Odessa Lakewood, 624, 6-0, 72.000
169. Saginaw Valley Lutheran, 620, 3-3, 36.167
170. Saginaw Swan Valley, 613, 4-2, 52.833
171. Dowagiac, 611, 3-3, 39.167
172. Flint Powers Catholic, 610, 4-2, 63.667
173. Big Rapids, 609, 4-2, 49.333
174. Richmond ^, 605, 5-1, 68.833
175. Wyoming Godwin Heights, 602, 4-2, 46.333
176. Remus Chippewa Hills ^, 600, 5-1, 65.667
177. River Rouge, 593, 6-0, 85.333
178. Clawson, 592, 4-2, 46.000
179. Birch Run, 583, 3-3, 40.500
180. Dearborn Heights Robichaud ^, 573, 5-1, 71.333
181. Gladwin, 571, 4-2, 44.833
182. Freeland, 563, 6-0, 85.333
183. Portland, 563, 6-0, 89.333
184. Essexville Garber, 557, 3-3, 42.000
185. Ann Arbor Gabriel Richard, 556, 4-2, 50.767
186. Detroit University Prep, 555, 3-3, 37.500
187. Southfield Bradford Academy, 550, 4-2, 43.667
188. Ida, 548, 6-0, 85.333
189. Kingsford, 547, 4-2, 59.267
190. Marine City, 540, 3-3, 39.667
191. Muskegon Oakridge ^, 538, 5-1, 58.900
192. Algonac, 532, 6-0, 76.000
193. Frankenmuth, 529, 6-0, 80.000
194. Olivet, 524, 4-2, 53.000
195. Chesaning, 523, 3-3, 41.500
196. Detroit Henry Ford, 523, 4-2, 46.333
197. Lansing Catholic ^, 517, 5-1, 68.833
198. Almont, 513, 6-0, 73.333
199. Onsted, 509, 4-2, 41.333
200. Detroit Central Collegiate, 508, 4-2, 47.500
201. Berrien Springs, 495, 6-0, 75.238
202. Parchment, 493, 4-2, 43.667
203. Stockbridge, 493, 4-2, 53.333
204. Ovid-Elsie, 491, 4-2, 57.667
205. Reed City, 491, 6-0, 69.867
206. Dundee, 489, 3-3, 29.500
207. Grayling, 489, 4-2, 53.500
208. Standish-Sterling, 489, 3-3, 35.667
209. Clinton Township Clintondale, 486, 4-2, 59.667
210. Menominee, 480, 6-0, 84.571
211. Harper Woods, 476, 4-2, 41.333
212. Manistee ^, 469, 5-1, 58.100
213. Brooklyn Columbia Central ^, 463, 5-1, 60.833
214. Buchanan, 459, 6-0, 80.000
215. Houghton, 443, 3-3, 28.952
216. Grand Rapids West Catholic, 442, 4-2, 58.667
217. Clare, 437, 3-3, 33.000
218. Kalkaska, 437, 3-3, 33.500
219. Kingsley, 431, 3-3, 35.000
220. Harrison ^, 430, 5-1, 57.667
221. Hillsdale, 430, 4-2, 53.500
222. Pinconning, 430, 3-3, 30.333
223. Jackson Lumen Christi, 426, 4-2, 58.833
224. Warren Michigan Collegiate, 421, 4-2, 54.833
225. Calumet, 419, 4-2, 47.919
226. Lakeview, 417, 4-2, 42.000
227. Sanford Meridian Early College, 408, 6-0, 68.000
228. Michigan Center, 406, 3-3, 30.667
229. Detroit Pershing, 405, 3-3, 33.333
230. Ithaca, 402, 6-0, 76.000
231. Byron, 399, 4-2, 44.167
232. Delton Kellogg ^, 398, 5-1, 61.833
233. Millington ^, 398, 5-1, 71.500
234. Montague, 396, 6-0, 73.333
235. Burton Bendle ^, 393, 5-1, 58.167
236. Oscoda, 391, 4-2, 35.667
237. Detroit Edison Public School Academy, 390, 4-2, 37.000
238. Monroe St. Mary Catholic Central, 389, 6-0, 85.333
239. Montrose, 386, 3-3, 35.000
240. Morley Stanwood, 386, 4-2, 47.833
241. Constantine, 385, 3-3, 39.500
242. Negaunee, 385, 6-0, 68.000
243. Maple City Glen Lake, 384, 4-2, 45.167
244. Boyne City ^, 383, 5-1, 60.833
245. Niles Brandywine, 380, 4-2, 44.200
246. Adrian Madison, 379, 3-3, 32.667
247. Vassar ^, 377, 5-1, 54.000
248. Mason County Central, 376, 4-2, 50.500
249. St Louis, 374, 3-3, 33.167
250. Laingsburg ^, 373, 5-1, 46.000
251. Watervliet ^, 372, 5-1, 62.167
252. Madison Heights Madison ^, 367, 5-1, 70.167
253. Manchester ^, 365, 5-1, 52.833
254. Ravenna, 357, 3-3, 31.333
255. Schoolcraft, 357, 6-0, 73.333
256. Charlevoix, 350, 4-2, 42.500
257. Leroy Pine River, 349, 3-3, 37.500
258. Quincy, 346, 3-3, 28.667
259. Grand Rapids NorthPointe Christian, 345, 6-0, 72.000
260. St. Charles, 345, 3-3, 37.833
261. Lawton ^, 342, 5-1, 52.833
262. Vandercook Lake, 341, 6-0, 62.667
263. Clinton, 335, 6-0, 66.667
264. Lake City, 331, 3-3, 41.833
265. Traverse City St. Francis, 320, 6-0, 80.000
266. Ishpeming Westwood, 315, 3-3, 39.205
267. Hesperia, 310, 6-0, 62.667
268. Sandusky, 310, 6-0, 69.333
269. Iron Mountain, 309, 4-2, 40.300
270. McBain, 307, 4-2, 50.833
271. Hartford, 305, 3-3, 35.500
272. Cass City, 304, 4-2, 42.333
273. Bridgman ^, 303, 5-1, 48.833
274. Gobles, 301, 4-2, 47.667
275. Marlette, 298, 3-3, 32.167
276. Union City, 298, 3-3, 29.167
277. Burton Atherton, 296, 3-3, 27.333
278. Elkton-Pigeon-Bay Port Laker, 296, 3-3, 35.167
279. Wyoming Tri-unity Christian, 296, 3-3, 29.033
280. Homer ^, 294, 5-1, 56.500
281. Pewamo-Westphalia, 292, 6-0, 61.333
282. Rochester Hills Lutheran Northwest, 292, 3-3, 30.833
283. Flint Hamady ^, 291, 5-1, 51.333
284. Dansville ^, 289, 5-1, 50.167
285. Springport, 287, 3-3, 29.833
286. Saginaw Nouvel ^, 285, 5-1, 57.100
287. Riverview Gabriel Richard ^, 284, 5-1, 56.833
A Game for Every Fan: District Openers
October 31, 2013
By Geoff Kimmerly
Second Half editor
A handful of MHSAA football teams always are safe to expect at Ford Field when we finish the annual five-week Finals run into Thanksgiving weekend.
But if the record number of at-large qualifiers – 31 – or the difficulty in picking the best first-round matchups are indications, this weekend could be ripe for plenty of the unexpected.
A total of 38 teams enter the playoffs perfect for the regular season. Ithaca is riding a national-record 51-game winning streak and seeking its fourth straight Division 6 title, while Detroit Cass Tech and Birmingham Brother Rice are going for their third straight each in Divisions 1 and 2, respectively.
How they might fare this time will be easier to predict over the next few weeks. But first things first, and in this case it’s our forecast of the best District openers all over the state this weekend. (Click to see the entire schedule, with dates, times and locations.)
Division 1
Detroit Catholic Central (7-2) at Northville (8-1)
Arguably the most competitive District in any division also includes Canton and Walled Lake Western, but Northville finished ahead of both to win the Kensington Lakes Activities Association. That doesn’t necessarily make the Mustangs favored. DCC’s only marks against came against reigning Division 2 champion Birmingham Brother Rice, and the Shamrocks have plenty of know-how in the postseason – they’ve finished Division 1 runner-up the last two seasons.
Others that caught my eye: East Kentwood (5-4) at Hudsonville (6-3), Rochester Hills Stoney Creek (6-3) at Rochester Adams (6-3), Belleville (6-3) at Saline (8-1), Canton (8-1) at Walled Lake Western (8-1).
Division 2
Southfield (7-2) at Birmingham Seaholm (8-1)
This is a meeting of Oakland Activities Association champions, with OAA White winner Southfield hoping to bounce back after last week’s loss to Red champ Clarkston. Blue champ Seaholm also lost in Week 9, to Detroit U-D Jesuit. The Bluejays have been considered MHSAA contenders since the preseason, but the Maples quietly are 16-3 over the last two years and poised to take the next step.
Others that caught my eye: Midland Dow (7-2) at Fenton (8-1), Muskegon Reeths-Puffer (7-2) at Muskegon (8-1), Ypsilanti Lincoln (7-2) at Wyandotte Roosevelt (9-0), Taylor Truman (7-2) at Allen Park (7-2).
Division 3
Zeeland East (5-4) at Zeeland West (8-1)
It’s fair to assume this won’t be much of a game – East got in with an at-large bid and its worst record since 2009. But there’s too much history to ignore. East did win their first matchup this season, in Week 2, 50-44. And after the Chix cruised to a 9-0 regular season in 2012, West upset them during the District opener. More payback would be the best way to end a four-game losing streak for East – although West hasn’t lost again this fall since that early defeat.
Others that caught my eye: Detroit Denby (7-2) at Detroit Mumford (7-2), Eaton Rapids (5-4) at Charlotte (7-2), Haslett (6-3) at DeWitt (9-0), Riverview (7-2) at Melvindale (7-2).
Division 4
Battle Creek Pennfield (8-1) at Paw Paw (8-1)
League champions clash in the best Division 4 game of opening night, Paw Paw from the Wolverine B Conference East and Pennfield from the Kalamazoo Valley Association. Pennfield has made the playoffs every season under the current format, which began in 1999 – but enters this run with perhaps its best defense of the bunch after giving up seven or fewer points in six games. Paw Paw is coming off a disappointing loss to Edwardsburg last week, but has been similarly sturdy stopping opponents – Week 9 was the first the Redskins gave up more than 14 points in a game.
Others that caught my eye: Harper Woods Chandler Park (7-2) at Richmond (8-1), Dowagiac (6-3) at Edwardsburg (9-0), Dearborn Heights Robichaud (6-3) at Pontiac Notre Dame Prep (7-2), Yale (6-3) at Saginaw Swan Valley (9-0).
Division 5
Grand Rapids West Catholic (5-4) at Portland (7-1)
Just as this matchup was tough to predict when these teams met for the Division 5 championship last season, it’s hard to read again this fall. The Raiders rebuilt quickly, with their lone loss two weeks ago to Division 3 contender DeWitt, 13-7. West Catholic made the playoffs with an at-large bid after a one-point win in Week 9 – but has won four straight after opening 0-3.
Others that caught my eye: Kingsford (7-2) at Grayling (8-1), Clare (7-2) at Reed City (9-0), Olivet (8-1) at Hopkins (7-2), River Rouge (8-1) at Monroe St. Mary Catholic Central (8-1).
Division 6
Reese (8-1) at Montrose (9-0)
Judging by last week’s Genesee Area Conference Blue deciding game, it's fair to guess this might not be much of a contest – Montrose ran past second-place Lake Fenton 37-0 to claim the title outright and also beat Reese 38-8 on opening night. But the Rockets haven’t loss since or scored fewer than 41 points since the first week of October.
Others that caught my eye: Elk Rapids (6-3) at Boyne City (7-2), Marlette (8-1) at Saginaw Nouvel (8-1), Schoolcraft (8-1) at Niles Brandywine (8-1), Manchester (7-2 at Grass Lake (8-1).
Division 7
Saugatuck (8-1) at Pewamo-Westphalia (8-1)
One of these teams has reached MHSAA semifinals each of the last three seasons and both have advanced to Ford Field once during that time. And each has prepared well this season against similar or bigger foes – Saugatuck’s lone loss was to playoff qualifier Decatur and it beat Division 6 qualifier Hartford. Pewamo-Westphalia beat Division 5 qualifier Lansing Catholic and lost only to Division 8 powerhouse New Lothrop.
Others that caught my eye: Traverse City St. Francis (5-4) at Iron River West Iron County (9-0), Royal Oak Shrine (6-3) at Madison Height Bishop Foley (6-3), St. Joseph Lake Michigan Catholic (6-2) at Cassopolis (6-3), Whittemore-Prescott (6-3) at Lake City (8-1).
Division 8
Bessemer (6-3) at Crystal Falls Forest Park (9-0)
We discussed this game at length when these teams met only two weeks ago and Forest Park celebrated avenging a 2012 loss to the Miners to this time clinch the Great Western Conference title outright. A win for Bessemer in this game would be even bigger as the Trojans are attempting to bounce back after failing to reach the District Finals last season for the first time since 2002.
Others that caught my eye: Munising (6-3) at Powers North Central (7-2), Mio (7-2) at Beal City (9-0), Clarkston Everest Collegiate (7-2) at Waterford Our Lady (7-2), Mount Pleasant Sacred Heart (6-3) at Coleman (7-2).
8-Player
Deckerville (5-4) at Peck (9-0)
Last season’s champion opens these playoffs against one of the favorites according to playoff points average. Deckerville won the MHSAA championship in 2012, the team's first season of 8-player, and won two of its final three regular season games this fall. Peck is one of three 9-0 teams in 8-player and owns the third-highest playoff point average in the division. The Pirates beat Deckerville 56-8 only two weeks ago.
Others that caught my eye: Akron-Fairgrove (7-2) at Owendale-Gagetown (8-1), Casonville Port-Sanilac (6-3) at Portland St. Patrick (7-2), Bellaire (5-4) at Kinde-North Huron (6-3), Engadine (5-4) at Cedarville (8-1).
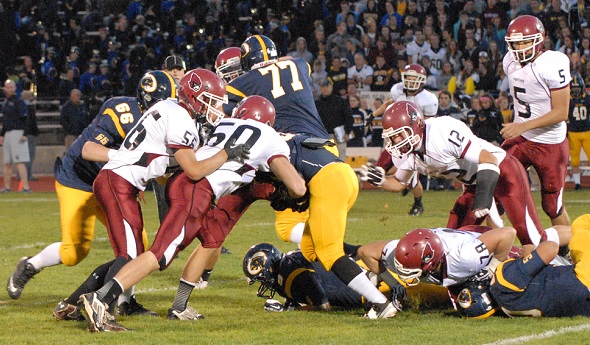
PHOTO: DeWitt (blue helmets) and Portland met in a Week 7 battle of undefeated teams, and both are considered Ford Field possibilities – DeWitt in Division 3 and Portland in Division 5. (Click to see more from High School Sports Scene.)