

2015 Week 8 Football Playoff Listing
October 13, 2015
By Geoff Kimmerly
Second Half editor
Here is a list of Michigan High School Athletic Association football playing schools, displaying their win-loss records and playoff averages through the seventh week of the season.
Schools on this list are in enrollment order for 11-player teams, with 8-player teams ordered by playoff average. An asterisk (*) beside a record indicates a team has eight or fewer games scheduled. A caret (^) beside a school’s name indicates a team is one win away from playoff qualification.
Those schools with 11-player teams with six or more wins playing nine-game schedules, or five or more wins playing eight games or fewer, will qualify for the MHSAA Football Playoffs beginning Oct. 30. Schools with 5-4, 4-3 or 4-4 records may qualify if the number of potential qualifiers by win total does not reach the 256 mark. Schools with six or more wins playing nine-game schedules or five or more wins playing eight games or fewer may be subtracted from the field based on playoff average if the number of potential qualifiers exceeds the 256 mark.
Once the 256 qualifying schools are determined, they will be divided by enrollment groups into eight equal divisions of 32 schools, and then drawn into regions of eight teams each and districts of four teams each. Those schools with 8-player teams will be ranked by playoff average at season’s end, and the top 16 programs will be drawn into regions of eight teams each for the playoff in that division, which also begins Oct. 30.
To review a list of all football playoff schools, individual school playoff point details and to report errors, visit the Football page of the MHSAA Website.
The announcement of the qualifiers and first-round pairings for both the 11 and 8-player playoffs will take place at 7 p.m. Oct. 25 on the Selection Sunday Show on FOX Sports Detroit. The playoff qualifiers and pairings will be posted to the MHSAA Website following the Selection Sunday Show.
11-Player Playoff Listing
1. Macomb Dakota ^, 2921, 5-2, 79.143
2. Grand Blanc, 2727, 4-3, 57.429
3. Clarkston ^, 2707, 5-2, 70.000
4. Utica Eisenhower, 2669, 4-3, 68.143
5. Sterling Heights Stevenson, 2634, 6-1, 90.857
6. Clinton Township Chippewa Valley ^, 2611, 5-2, 82.143
7. East Kentwood ^, 2581, 5-2, 77.571
8. Howell ^, 2567, 5-2, 70.857
9. Rockford, 2561, 4-3, 64.000
10. Dearborn Fordson, 2477, 4-3, 56.571
11. Detroit Cass Tech, 2285, 6-1, 88.857
12. Northville, 2281, 7-0, 100.571
13. Brighton, 2211, 6-1, 89.714
14. Troy Athens, 2153, 4-3, 57.714
15. Detroit Catholic Central ^, 2138, 5-2, 69.095
16. Utica Ford ^, 2080, 5-2, 77.000
17. Canton ^, 2076, 5-2, 74.286
18. Lapeer, 2059, 7-0, 96.000
19. Plymouth, 2057, 6-1, 87.286
20. Ann Arbor Pioneer, 2025, 6-1, 87.714
21. Hartland ^, 2017, 5-2, 76.571
22. West Bloomfield, 1932, 7-0, 101.714
23. Dearborn, 1921, 4-3, 52.429
24. Saline *, 1879, 7-0, 101.714
25. Livonia Stevenson, 1831, 6-1, 90.000
26. Grandville, 1825, 4-3, 54.286
27. Warren Mott ^, 1810, 5-2, 74.429
28. Holt ^, 1788, 5-2, 64.000
29. Davison, 1765, 4-3, 55.429
30. Hudsonville, 1763, 6-1, 93.000
31. Belleville, 1735, 6-1, 87.143
32. Romeo, 1673, 7-0, 106.286
33. Grand Ledge, 1663, 7-0, 91.429
34. Waterford Mott, 1651, 4-3, 54.286
35. Grosse Pointe South ^, 1629, 5-2, 74.286
36. Livonia Churchill, 1620, 4-3, 54.429
37. Livonia Franklin, 1615, 4-3, 53.429
38. Walled Lake Northern ^, 1611, 5-2, 71.286
39. Warren DeLaSalle, 1572, 6-1, 92.857
40. Sterling Heights ^, 1561, 5-2, 67.429
41. Detroit Martin Luther King, 1537, 7-0, 105.143
42. Flint Carman-Ainsworth, 1533, 4-3, 53.143
43. Oak Park, 1530, 4-3, 56.857
44. Warren Cousino, 1514, 4-3, 53.571
45. Detroit U-D Jesuit, 1486, 4-3, 56.095
46. Traverse City Central, 1474, 7-0, 105.524
47. Walled Lake Western, 1462, 7-0, 107.429
48. Midland, 1419, 6-1, 86.571
49. Dearborn Edsel Ford, 1380, 4-3, 52.857
50. Lincoln Park ^, 1363, 5-2, 68.286
51. Portage Central, 1351, 7-0, 101.714
52. Wyandotte Roosevelt ^, 1346, 5-2, 73.286
53. Battle Creek Lakeview ^, 1344, 5-2, 72.000
54. Grosse Pointe North, 1341, 4-3, 55.286
55. Detroit East English ^, 1338, 5-2, 67.857
56. Swartz Creek, 1322, 4-3, 58.286
57. Southfield-Lathrup ^, 1320, 5-2, 61.857
58. Grand Rapids Ottawa Hills, 1280, 4-3, 53.143
59. Southfield ^, 1269, 5-2, 72.286
60. North Farmington, 1267, 4-3, 53.714
61. Port Huron Northern, 1260, 4-3, 57.556
62. Midland Dow, 1256, 6-1, 82.857
63. Royal Oak, 1248, 4-3, 50.429
64. Berkley ^, 1248, 5-2, 64.143
65. Birmingham Groves, 1248, 7-0, 94.857
66. Jackson ^, 1244, 5-2, 59.571
67. Muskegon Mona Shores, 1239, 7-0, 101.714
68. Farmington Hills Harrison, 1218, 6-1, 88.571
69. Farmington, 1176, 4-3, 58.857
70. Mattawan, 1175, 4-3, 55.571
71. Lowell, 1168, 6-1, 90.000
72. Gibraltar Carlson ^, 1140, 5-2, 65.286
73. Grand Rapids Forest Hills Northern, 1124, 6-1, 86.286
74. East Lansing, 1123, 4-3, 54.286
75. Muskegon, 1113, 6-1, 95.429
76. Fenton, 1108, 6-1, 89.571
77. Ypsilanti Community, 1088, 4-3, 55.000
78. Byron Center ^, 1070, 5-2, 69.000
79. Holly, 1068, 4-3, 60.143
80. Redford Thurston, 1064, 4-3, 56.857
81. Mt. Pleasant ^, 1061, 5-2, 69.000
82. Ortonville-Brandon, 1060, 4-3, 56.714
83. Allen Park, 1058, 6-1, 88.571
84. St. Johns ^, 1053, 5-2, 75.857
85. Zeeland East, 1040, 4-3, 68.571
86. Mason ^, 1033, 5-2, 65.429
87. Orchard Lake St. Mary's *, 1032, 6-1, 92.286
88. Hamtramck, 984, 4-3, 43.143
89. St. Joseph, 980, 6-1, 83.857
90. East Grand Rapids ^, 975, 5-2, 78.857
91. Petoskey ^, 970, 5-2, 68.762
92. DeWitt, 960, 7-0, 108.571
93. Romulus ^, 956, 5-2, 65.143
94. Trenton, 953, 6-1, 86.429
95. Linden, 947, 6-1, 88.857
96. Cedar Springs ^, 943, 5-2, 66.429
97. Gaylord ^, 940, 5-2, 58.762
98. Sturgis ^, 926, 5-2, 61.143
99. Riverview ^, 912, 5-2, 55.143
100. Grand Rapids Christian, 905, 4-3, 58.857
101. Parma Western, 876, 4-3, 51.286
102. Haslett, 875, 4-3, 58.000
103. Stevensville Lakeshore, 874, 4-3, 62.429
104. Warren Fitzgerald, 871, 4-3, 47.857
105. Fruitport, 865, 4-3, 46.238
106. Marshall, 863, 6-1, 82.000
107. Coldwater, 863, 7-0, 94.857
108. Vicksburg ^, 858, 5-2, 62.000
109. Edwardsburg, 851, 7-0, 86.857
110. Sault Ste. Marie ^, 850, 5-2, 69.952
111. Bay City John Glenn, 847, 4-3, 44.810
112. Chelsea, 845, 6-1, 73.571
113. Zeeland West, 840, 7-0, 98.286
114. Ada Forest Hills Eastern, 828, 7-0, 89.143
115. Dearborn Divine Child, 827, 4-3, 54.857
116. Milan ^, 820, 5-2, 66.714
117. Plainwell, 807, 4-3, 48.571
118. Bloomfield Hills Cranbrook Kingswood, 794, 7-0, 75.429
119. Marysville ^, 783, 5-2, 72.000
120. Goodrich ^, 754, 5-2, 63.952
121. Pontiac Notre Dame Prep, 728, 6-1, 87.429
122. Allendale, 720, 4-3, 45.286
123. Warren Lincoln, 697, 4-3, 43.571
124. Harper Woods Chandler Park Academy ^, 692, 5-2, 57.714
125. Detroit Country Day, 685, 6-1, 77.000
126. Comstock Park ^, 682, 5-2, 67.714
127. Detroit Cesar Chavez Academy ^, 681, 5-2, 48.429
128. Croswell-Lexington ^, 668, 5-2, 54.143
129. St. Clair Shores South Lake, 668, 7-0, 85.714
130. Hudsonville Unity Christian ^, 665, 5-2, 57.143
131. Grand Rapids Catholic Central, 658, 6-1, 85.143
132. Williamston, 657, 4-3, 52.143
133. Whitehall, 656, 4-3, 48.143
134. Corunna, 656, 6-1, 71.238
135. Alma, 642, 4-3, 46.429
136. Detroit Collegiate Prep, 632, 7-0, 81.333
137. Benton Harbor, 631, 4-3, 58.857
138. Lake Fenton, 625, 4-3, 48.952
139. Lake Odessa Lakewood, 624, 7-0, 76.571
140. Saginaw Swan Valley, 613, 4-3, 48.714
141. Dowagiac, 611, 4-3, 52.143
142. Flint Powers Catholic ^, 610, 5-2, 66.143
143. Big Rapids, 609, 4-3, 45.429
144. Richmond, 605, 6-1, 70.429
145. Wyoming Godwin Heights, 602, 4-3, 41.857
146. Remus Chippewa Hills, 600, 6-1, 72.429
147. River Rouge, 593, 6-1, 75.000
148. Clawson, 592, 4-3, 42.143
149. Birch Run, 583, 4-3, 46.571
150. Dearborn Heights Robichaud ^, 573, 5-2, 64.000
151. Gladwin, 571, 4-3, 41.143
152. Freeland, 563, 7-0, 90.286
153. Portland, 563, 7-0, 94.857
154. Essexville Garber, 557, 4-3, 46.714
155. Ann Arbor Gabriel Richard, 556, 4-3, 46.857
156. Detroit University Prep, 555, 4-3, 46.476
157. Southfield Bradford Academy, 550, 4-3, 39.286
158. Ida, 548, 7-0, 86.857
159. Kingsford ^, 547, 5-2, 64.000
160. Marine City, 540, 4-3, 52.571
161. Muskegon Oakridge, 538, 6-1, 65.524
162. Algonac, 532, 7-0, 84.571
163. Frankenmuth, 529, 7-0, 84.571
164. Olivet ^, 524, 5-2, 59.429
165. Chesaning, 523, 4-3, 47.286
166. Detroit Henry Ford ^, 523, 5-2, 53.571
167. Lansing Catholic, 517, 6-1, 71.714
168. Almont, 513, 6-1, 66.000
169. Onsted, 509, 4-3, 37.286
170. Detroit Central Collegiate ^, 508, 5-2, 53.429
171. Berrien Springs, 495, 7-0, 81.714
172. Parchment, 493, 4-3, 39.714
173. Stockbridge ^, 493, 5-2, 55.143
174. Ovid-Elsie ^, 491, 5-2, 62.286
175. Reed City, 491, 7-0, 76.000
176. Dundee, 489, 4-3, 39.429
177. Standish-Sterling, 489, 4-3, 42.286
178. Grayling ^, 489, 5-2, 56.286
179. Clinton Township Clintondale, 486, 4-3, 53.286
180. Menominee, 480, 7-0, 91.143
181. Harper Woods, 476, 4-3, 38.476
182. Manistee, 469, 6-1, 60.238
183. Brooklyn Columbia Central, 463, 6-1, 60.286
184. Buchanan, 459, 7-0, 80.000
185. Grand Rapids West Catholic ^, 442, 5-2, 67.714
186. Kalkaska, 437, 4-3, 40.571
187. Clare, 437, 4-3, 44.714
188. Kingsley, 431, 4-3, 39.571
189. Harrison ^, 430, 5-2, 51.429
190. Hillsdale ^, 430, 5-2, 55.286
191. Jackson Lumen Christi ^, 426, 5-2, 67.857
192. Warren Michigan Collegiate ^, 421, 5-2, 62.333
193. Calumet ^, 419, 5-2, 53.833
194. Lakeview, 417, 4-3, 39.286
195. Sanford Meridian Early College, 408, 7-0, 76.571
196. Detroit Pershing, 405, 4-3, 38.000
197. Ithaca, 402, 7-0, 78.857
198. Byron, 399, 4-3, 40.000
199. Delton Kellogg ^, 398, 5-2, 57.143
200. Millington, 398, 6-1, 75.143
201. Montague, 396, 7-0, 75.429
202. Burton Bendle, 393, 6-1, 61.429
203. Oscoda, 391, 4-3, 34.857
204. Detroit Edison Public School Academy ^, 390, 5-2, 44.429
205. Monroe St. Mary Catholic Central, 389, 7-0, 91.429
206. Montrose, 386, 4-3, 42.857
207. Morley Stanwood ^, 386, 5-2, 50.429
208. Constantine, 385, 4-3, 47.857
209. Negaunee, 385, 6-1, 61.405
210. Maple City Glen Lake, 384, 4-3, 42.143
211. Boyne City, 383, 6-1, 67.143
212. Niles Brandywine ^, 380, 5-2, 42.143
213. Adrian Madison, 379, 4-3, 37.429
214. Vassar, 377, 6-1, 60.143
215. Mason County Central, 376, 4-3, 46.571
216. Laingsburg ^, 373, 5-2, 41.571
217. Watervliet, 372, 6-1, 69.429
218. Madison Heights Madison, 367, 6-1, 76.286
219. Manchester, 365, 6-1, 56.857
220. Schoolcraft, 357, 7-0, 78.857
221. Charlevoix ^, 350, 5-2, 47.000
222. Leroy Pine River, 349, 4-3, 43.857
223. Grand Rapids NorthPointe Christian, 345, 7-0, 78.857
224. Lawton ^, 342, 5-2, 48.143
225. Vandercook Lake, 341, 7-0, 67.429
226. Clinton, 335, 7-0, 73.143
227. Traverse City St. Francis, 320, 7-0, 83.810
228. Ishpeming Westwood, 315, 4-3, 44.048
229. Hesperia, 310, 7-0, 69.714
230. Sandusky, 310, 7-0, 72.000
231. Iron Mountain, 309, 4-3, 38.690
232. McBain ^, 307, 5-2, 56.429
233. Hartford, 305, 4-3, 44.429
234. Cass City ^, 304, 5-2, 44.429
235. Bridgman, 303, 6-1, 52.286
236. Gobles, 301, 4-3, 44.143
237. Union City, 298, 4-3, 36.571
238. Marlette, 298, 4-3, 38.143
239. Homer, 294, 6-1, 61.143
240. Rochester Hills Lutheran Northwest, 292, 4-3, 37.000
241. Pewamo-Westphalia, 292, 7-0, 68.571
242. Flint Hamady, 291, 6-1, 55.762
243. Dansville, 289, 6-1, 52.286
244. Springport, 287, 4-3, 38.571
245. Saginaw Nouvel, 285, 6-1, 66.667
246. Riverview Gabriel Richard ^, 284, 5-2, 53.143
247. Grosse Pointe Woods University Liggett ^, 282, 5-2, 50.143
248. Harbor Springs, 281, 4-3, 32.571
249. Flint Beecher *, 278, 5-1, 67.762
250. Ishpeming *, 278, 6-0, 72.000
251. Carson City-Crystal, 277, 4-3, 32.571
252. Detroit Loyola ^, 276, 5-2, 65.429
253. New Lothrop, 276, 7-0, 75.429
254. Ubly ^, 271, 5-2, 48.286
255. Saugatuck, 271, 7-0, 65.143
256. Cassopolis ^, 270, 5-2, 50.857
257. Whittemore-Prescott, 267, 4-3, 41.000
258. Concord ^, 267, 5-2, 49.143
259. Decatur ^, 266, 5-2, 42.429
260. Lincoln Alcona ^, 265, 5-2, 38.857
261. Unionville-Sebewaing ^, 262, 5-2, 50.714
262. Detroit Allen Academy, 258, 4-3, 36.571
263. Ottawa Lake Whiteford, 255, 6-1, 50.857
264. Indian River Inland Lakes, 251, 4-3, 32.714
265. Onekama, 250, 6-1, 45.286
266. Petersburg-Summerfield ^, 240, 5-2, 47.143
267. Beal City, 228, 6-1, 67.571
268. Johannesburg-Lewiston, 226, 6-1, 61.429
269. Merrill, 225, 4-3, 42.000
270. St. Ignace, 225, 7-0, 64.000
271. Saginaw Michigan Lutheran Seminary, 223, 6-1, 64.857
272. Melvindale Academy for Business & Tech, 219, 4-3, 44.714
273. Mayville, 217, 4-3, 31.429
274. L'Anse, 215, 4-3, 40.714
275. Pittsford, 211, 4-3, 34.143
276. Newberry ^, 211, 5-2, 44.500
277. Vestaburg ^, 205, 5-2, 37.429
278. Mendon, 200, 4-3, 39.857
279. Bark River-Harris ^, 194, 5-2, 45.655
280. Morenci ^, 191, 5-2, 50.714
281. Munising, 191, 6-1, 53.143
282. Central Lake ^, 189, 5-2, 38.143
283. Fowler, 183, 6-1, 48.714
284. Sterling Heights Parkway Christian ^, 178, 5-2, 50.286
285. Muskegon Catholic Central *, 177, 5-1, 66.619
286. Adrian Lenawee Christian, 170, 6-1, 44.667
287. Crystal Falls Forest Park *^, 163, 4-2, 39.417
288. Climax-Scotts, 163, 7-0, 54.095
289. Frankfort, 160, 6-1, 62.143
290. Waterford Our Lady, 157, 7-0, 78.857
291. Lake Linden-Hubbell, 155, 7-0, 68.000
292. Colon, 153, 4-3, 35.524
293. Hillman, 146, 6-1, 44.714
294. Mt. Pleasant Sacred Heart, 142, 4-3, 37.714
295. Bay City All Saints, 118, 4-3, 28.810
296. Clarkston Everest Collegiate, 113, 4-3, 40.000
8-Player Playoff Listing
1. Posen, 84, 7-0, 60.571
2. Battle Creek St. Philip, 144, 7-0, 57.143
3. Owendale-Gagetown, 49, 7-0, 56.762
4. Powers North Central, 198, 7-0, 52.571
5. Morrice, 169, 6-1, 50.000
6. Deckerville, 178, 6-1, 47.000
7. Waldron, 88, 6-1, 46.571
8. Peck, 152, 6-1, 43.000
9. Cedarville, 144, 5-2, 40.286
10. Lawrence, 189, 6-1, 40.113
11. Rapid River, 111, 5-2, 40.000
12. Portland St. Patrick, 87, 6-1, 39.571
13. Stephenson, 186, 5-2, 37.857
14. Engadine, 85, 5-2, 36.714
15. New Haven Merritt Academy, 148, 5-2, 35.619
16. Pickford, 164, 4-3, 30.429
17. Onaway, 196, 4-3, 29.429
18. Bellaire, 134, 4-3, 28.571
19. Marion *, 145, 4-3, 28.048
20. Webberville, 184, 4-3, 26.286
21. Caseville, 91, 4-3, 24.476
22. Kinde-North Huron, 147, 3-4, 21.857
23. Akron-Fairgrove, 99, 3-4, 21.810
24. Kingston, 187, 3-4, 21.143
25. Tekonsha, 148, 3-4, 21.000
26. Baraga, 164, 3-4, 20.857
27. Ewen-Trout Creek, 126, 2-5, 14.714
28. Big Rapids Crossroads Academy, 190, 2-5, 14.405
29. Burr Oak, 75, 2-5, 13.143
30. St. Helen Charlton Heston Academy, 108, 2-5, 12.714
31. Eben Junction Superior Central, 123, 1-6, 8.857
32. St. Joseph Michigan Lutheran, 103, 1-6, 8.143
33. Hale *, 132, 1-5, 7.810
34. Ontonagon, 129, 1-6, 7.571
35. Pellston, 170, 1-6, 6.857
36. Carsonville-Port Sanilac, 120, 0-7, 3.143
37. Litchfield, 92, 0-7, 3.143
38. Flint Michigan School For The Deaf *, 47, 0-6, 2.476
39. Covert *, 91, 0-5, 2.167
40. Brimley, 142, 0-7, 2.000</p">
'22 Game' Lasts 2 Plays, Lives on
By
Ron Pesch
MHSAA historian
October 26, 2015
What would you do with 22 seconds to right a wrong?
In Michigan, the longest football game in high school sports history was played on September 23, 1977 when Detroit Southeastern defeated Detroit Northeastern 42-36 in nine overtimes.
But what is the shortest?
On the evening of Thursday, Nov. 5, 1953, Eaton County foes Bellevue and Vermontville squared off in a Tri-C Conference battle. It was a home contest for Vermontville, but without illumination at its field, the game was staged just west beneath the lights at Nashville High School in Barry County.
The dominant team in Tri-C play over the previous three years, Bellevue’s Broncos had posted three consecutive undefeated seasons from 1950 and 1952. However, graduation took its toll and with only five returning veterans in the fall of 1953, Bellevue lost its nonconference season opener to Homer. The Broncos had also dropped a pair of league contests, to Lake Odessa and Olivet, just prior to the Vermontville game, and entered with a 4-3 record.
Vermontville brought a 4-2 mark into the contest, and was in a four-way tie with Bellevue, Nashville and Lake Odessa for second in the conference.
The Broncos and Wildcats were evenly matched and played to a scoreless tie in the first half. Vermontville opened up a 6-0 lead on a 20-yard end sweep by the Wildcats’ quarterback Pete Benton in the third quarter, but entered the final minutes of the game trailing 12-6 thanks to a TD run by Bellevue’s Jim Smith and an early-fourth quarter scoring pass from Smith to Bob Babbitt.
Coach Dave McDowell’s Wildcats mounted a long final drive, and fans strapped in for a thrilling finish. Pushing deep into Bellevue territory, Vermontville faced a fourth down and eight from the 16-yard line with under a minute to play when Benton launched a desperation pass to the end zone.
The pass fell incomplete, but Bellevue was flagged for pass interference. Officials stepped off the penalty and awarded Vermontville the ball at the one-yard line, but the Wildcats’ plunge into the line fell an inch short on what was called a repeated fourth down play. Vermontville took possession and ran out the clock.
Following the game, Coach McDowell protested the ruling to officials, correctly stating that his team should have been awarded an automatic first down and goal from the 1-yard-line on the penalty, according to high school rules. Appealing the call, the situation was brought to the attention of the league, MHSAA executive director Charles Forsythe and the MHSAA athletic board.
On Wednesday, Nov. 11, the state athletic board agreed an error had been made, but did not order a replay. Instead, they noted three possible solutions:
- Result left as it was.
- Called a no contest.
- Replay it at the point of infraction.
The board moved a final decision back to the league. Because of the possible impact on the final conference standings, and eventually, the awarding of the league’s all-sports trophy, the Tri-C Conference opted to replay the contest from the point of infraction – the 1-yard line – with 22 seconds placed on the clock.
 The news of the league’s decision was blasted out by the news services nationwide, and immediately, the pending replay of a small town contest captured the imagination of reporters and sports fans across the United States.
“Shortest ‘Game’ in History?” read the headline in the Lexington, Kentucky Herald. From Biloxi, Mississippi, to Boston, Massachusetts, from Rockford, Illinois to Omaha, Nebraska and Seattle Washington, sports aficionados read the news about the error. Best of all, details flowed forth on the plan to replay critical seconds that might alter the result, fulfilling every fan’s dream.
So began the longest huddle in history.
“What would you do?” was the question on the lips of coaches and followers in barber shops and factories. Detroit Free Press writer George Puscas asked that very question to some of Michigan’s top coaches.
Detroit Lions coach Buddy Parker offered his advice to Vermontville’s coach McDowell.
“The other team will be expecting a run,” noted Parker, “so I would fake a run off tackle then throw a pass in the other direction – with three receivers downfield.”
Michigan State’s legendary Biggie Munn stated the obvious:
“Call a scoring play.”
University of Michigan head coach Bennie Oosterbaan was tied up preparing for the Wolverines’ upcoming contest with MSU, so instead U-M end coach Bill Orwig weighed in with a tongue-in-cheek recommendation:
“Take the time out.”
Earl “Dutch” Clark, in charge at the University of Detroit, suggested that McDowell diagram “two of the most unusual offensive formations … anything to confuse the defense. The first play should be a running play and if it didn’t work, take time out then try again.”
Wayne University’s coach Lou Zarza was the most specific of them all.
“On a goal line stand, the defense usually drifts toward the middle. So I would fake the ball to the right halfback on a slant, then send the fullback with the ball wide to the right, outflanking the defense. It’s a good goal line play on the T formation.”
Suggestions came from all over. A gentleman in Syracuse, New York, even penned a personal letter to McDowell with a sure-fire suggestion.
Three days after the 1953 prep season had officially ended, on the afternoon of Monday, Nov. 16, the same officiating crew and the Vermontville and Bellevue squads emerged and again travelled to Nashville to line up for what can arguably be called the shortest – or perhaps the longest – game in high school football history.
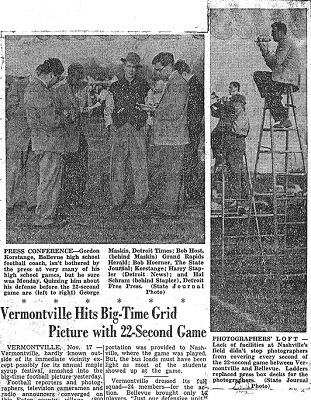
Reporters from Detroit, Grand Rapids, Lansing and Battle Creek converged on the city for 22 seconds of football. High school reporting legends Hal Schram of the Detroit Free Press, Bob Hoerner of the Lansing State Journal, George Maskin of the Detroit Times, Harry Stapler of the Detroit News and writers from the Associated Press and United Press International all descended upon mid-Michigan, “almost as if the Rose Bowl was to be played.”
“That game brought more publicity to coach Gordon Korstange’s 6-3 squad then his teams received for posting three consecutive unbeaten seasons in 1950, 1951 and 1952,” recalled 80-year old Burton H. Brooks, who was the only reporter who had covered the original contest, and one of many covering the replay. A graduate of Bellevue, he was a freshman at Michigan State at the time, earning money as a sports stringer for the Bellevue Gazette and Charlotte Republican Tribune.
Beneath sunny skies, “a crowd of over 500 fans and curiosity seekers, most of them attired in shirt sleeves, lined the field on both sides near the east end of the Nashville gridiron,” wrote Brooks, many years later. “At 5:00 the shrill blast of an official’s whistle split the air, announcing time for the game.”
Attendance was way up from the original contest, and in an unusual move for the time, Kalamazoo television station WKZO announced that they would send a crew to Nashville and then televise the game – (all 22 seconds of it!) – Tuesday evening. In addition, 10 newspaper photographers were on site to capture images from the game.
While the size of the crowd was up, turnout on the football squads had decreased. Vermontville dressed its full squad of 24 for the showdown, but kept out two regular tackles and his first-string quarterback, as all had been on the injured list at the end of the first clash.
Meanwhile, Bellevue brought only 14 players.
“Just our defensive unit and enough to run back the kickoff,” Korstange told the Lansing State Journal, prepared for a situation that could arise if Vermontville scored.
“Three of the defensive starters had decided to go deer hunting instead,” said Brooks discussing the shortened game, “so Bellevue needed to call up some kids for the game from the junior varsity squad.”
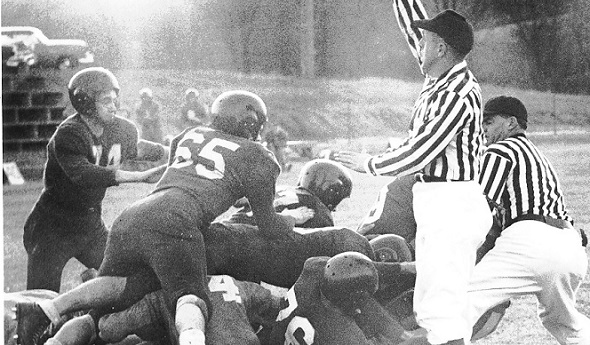
“Bellevue won its sixth game of the year, downing Vermontville in a sensational goal line stand in the famous ‘22’ Game” at Nashville last Monday,” wrote Brooks in the Bellevue Gazette. “Coach Dave McDowell’s Wildcats ran two plays against Bellevue, but couldn’t dent the solid Bronco defense. On the first play the Wildcats sent big Bob Steward up center, but he was driven back a yard by the entire center of the Bellevue line.”
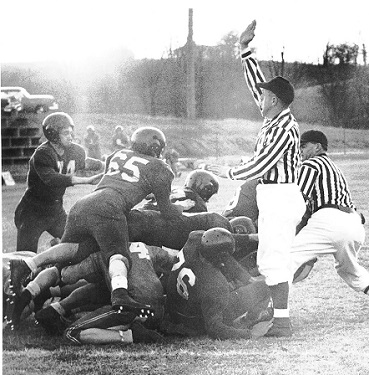 Following a timeout, the Green and White tried to sneak quarterback Pete Benton across the line to the left of center as the ball carrier on the second play, but the hole was quickly plugged by tackle Donald Rogers and guard Jerry Babbitt. Steward had been stopped by Bellevue guard Wayne Lesser. Dale Spotts, Bob Babbitt, Harold Messenger, Ralph Hales, Dick Moon, Jim Smith, Gordon Smith, and Ed Bessemer filled the other defensive spots and ensured the result of the first game went unchanged.
Once again, the wire services blasted their report from sea to shining sea.
“Officials Didn’t Rob Vermontville Team” screamed the headline in the Miami Daily News. Beneath an AP photo, residents of the Florida town were treated to a detailed account of the contest.
“Prep Grid Game Ends Same Way Following 11-Day Break” read the caption in the Dallas Morning News in football-crazed Texas.
“Replayed Grid Game Ends with the Same Result as Before,” read the headline in the Seattle, Washington, Daily Times.
As noted at the time, it certainly wasn’t the first, nor would it be the last, that a refereeing crew made a mistake in a game. Fans then, like now, were reminded officials are only human.
Bellevue ended the extended season in a tie for second with Lake Odessa, with 5-2 marks. For the first time in league history the Tri-C gridiron championship was awarded to Olivet, which, at 8-0, posted its first unbeaten season and, as it turned out, unseated Bellevue for the league’s 1953-54 all-sports trophy.
More than 60 years later, a forgotten showdown between high school football teams, played out before national attention in little Nashville, Michigan, still stands as one of the most entertaining and unusual sports moments in the history of America.
 Ron Pesch has taken an active role in researching the history of MHSAA events since 1985 and began writing for MHSAA Finals programs in 1986, adding additional features and "flashbacks" in 1992. He inherited the title of MHSAA historian from the late Dick Kishpaugh following the 1993-94 school year, and resides in Muskegon. Contact him at [email protected] with ideas for historical articles.
PHOTOS: (Top and below) What's believed to be a Battle Creek Enquirer photo shows one of the goal line stands by the Bellevue defense against Vermontville. (Middle) The Lansing State Journal reported on the nationwide reporting of the "22-second game."