
Inside Selection Sunday: Mapping the Football Playoffs
October 24, 2011
Sitting on the other side of this process for a number of years, I can admit to occasionally scratching my cynical head over some of the matchups that have come out of Selection Sunday.
How could teams so far from each other play in the same district? Why would two schools in the same town play in different regionals? Are they picking out of a hat at 1661 Ramblewood Drive?
Now, I have answers.
Sunday morning, we filed into headquarters for what might be the most important non-game day on the MHSAA calendar. “We” were made up of half of the MHSAA staff, plus a representative from the Michigan High School Football Coaches Association.
Here’s some of what I learned from being a part of the process:
? First, a brief history lesson. In early years (or until the middle of the last decade), lines were drawn by hand. Dots representing qualifying schools were pasted on maps, one map for each division, and those maps were then covered by plastic sheets. Districts and regionals literally were drawn with dry-erase markers. No longer. Using a variety of spreadsheets and mapping software, we’ve gone digital. Staff is split into two teams, each considering four divisions (and the 8-player map) before we reconvene and look at all nine divisions together.
? We are presented digital maps of the state covered in dots. That’s about it. The rule of the day, simply, is “geography rules.” Which teams are represented by the dots is not considered, much less discussed, until lines are drawn. While considering my group’s first map, I began to bring up teams – and immediately was shot down (with good reason). Teams, matchups, rivalries, previous playoff pairings, etc. DO NOT come into play. We draw boxes in what we figure are the most logical ways of making districts and regions work.
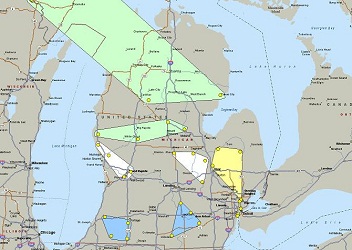
? Travel distance and ease DO come into play. This especially is true when considering which districts will include teams from the Upper Peninsula. An example: Marquette is closer to the schools we placed in its district – Fenton, Bay City Western and Okemos – than some other options because those schools are closer to I-75. Schools further north on the map but farther from a main highway would’ve created longer trips.
? Sometimes, maps get ugly. And sometimes, it was a matter of choosing the least ugly situation. Of course, a D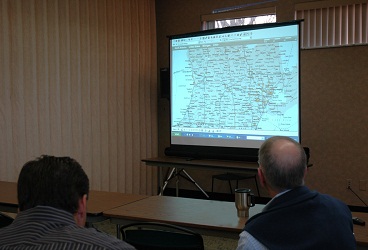 ivision 4 District of Lansing Sexton, Dearborn Heights Robichaud, Battle Creek Pennfield and Vicksburg isn’t ideal. But with no other Division 4 schools within 35 miles of Lansing, we were put in a tough spot. Add in that there were 13 teams in the Detroit area, leaving one as the odd team out of three districts based there. Something had to give, and drawing things up as we did caused the fewest messes.
? Considering how to set up the entire state is different than figuring out what teams make the most sense for just one school or area. And shifting just one dot on a map can change things for all 32.
? Back to “geography rules.” The Division 8 district including Saugatuck, Muskegon Catholic, Mendon and St. Joseph Lake Michigan Catholic might be the most competitive, on paper, in the state. Saugatuck is the reigning MHSAA runner-up in the division, and Muskegon Catholic and Mendon were ranked Nos. 1 and 2, respectively, in the most recent Association Press poll. Seeing that after we’d drawn the line caused a collective “ouch.” But again, the line was drawn based on dots on a map.
I thought back on some of the matchups I’d questioned in the past, and came back to what I’d ask people now: How would you do things differently?
I imagine there would be some creative answers, but I also would guess we considered those scenarios too.
And remember, determining the playoff schedule is just one step in many. Eight state champions must survive it, regardless of which opponents they face along the way.
Warriors Continue Fight Against Cancer
September 26, 2014
By Geoff Kimmerly
Second Half editor
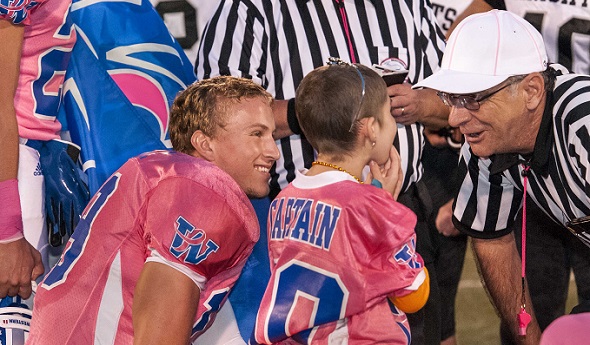
An exemplary effort that has raised more than $200,000 for cancer research and awareness will continue tonight at Walled Lake Western when the Warriors take on Waterford Mott in its annual “Warriors for Warriors” game.
This is the fourth season Western has hosted the event, which benefits the Susan G. Komen Detroit Race for the Cure, St. Baldrick’s Foundation for Pediatric Cancer and the American Cancer Society. Fans will be wearing pink shirts designed for the event, with more than 1,000 sold as of two weeks ago.
Last fall, “Warriors for Warriors” was recognized by the NFL and featured in a 30-second commercial shown during NFL football games, and the team was hosted and honored by the Detroit Lions (see below).
“We continue to be grateful for the selfless dedication of parents, staff members, community members and all of the countless volunteers who support the fourth annual Pink Out effort,” Walled Lake superintendent Kenneth Gutman said. “Breast cancer and all cancers continue to challenge thousands of people, and we will continue to work together to eradicate it.”
A “Warriors’ Survivors Parade” will kick off the event at 6 p.m. and include patients, survivors and others who wish to honor those who are fighting or have died after battling cancer of any form. The parade will continue into the stadium.
Prior to the 7:30 p.m. kickoff, Western’s players, wearing pink jerseys sponsored in honor of those who have fought the disease, will line the field from end zone to end zone with jersey honorees and their families. More than 170 people have been honored during the first three years of the event.
The game’s honorary captain is Commerce Elementary fifth-grader Sydney Balzer, who has fought leukemia twice and founded a community service project, Colors for Cancer Kids.
For information, click for the Warriors for Warriors website and follow the effort on Twitter @WLW_W4W.
PHOTO: Walled Lake Western’s Kyle Bambard and 7-year-old Akayla Hodgins call the coin flip during the 2013 Warriors for Warriors game.