
2016-17 Classifications Announced
By
Geoff Kimmerly
MHSAA.com senior editor
March 29, 2016
Classifications for Michigan High School Athletic Association elections and postseason tournaments in traditionally classified sports (A, B, C, D) for the 2016-17 school year have been announced, with enrollment breaks for postseason tournaments set up by divisions posted to each sport’s page on the MHSAA Website.
Classifications for the upcoming school year are based on a second semester count date, which for MHSAA purposes was Feb. 10. The enrollment figure submitted for athletic classification purposes may be different from the count submitted for school aid purposes, as it does not include students ineligible for athletic competition because they reached their 19th birthday prior to September 1 of the current school year and will not include alternative education students if none are allowed athletic eligibility by the local school district.
After all the counts are submitted, tournament-qualified member schools are ranked according to enrollment, and then split as closely into quarters as possible. For 2016-17, there are 751 tournament-qualified member schools with 187 schools in Class A, and 188 schools in Class B, Class C and Class D.
Effective with the 2016-17 school year, schools with 881 or more students are in Class A in MHSAA postseason tournament competition. The enrollment limits for Class B are 412-880; Class C is 207-411; and schools with enrollments of 206 and fewer are Class D. The break between Classes A and B increased six students from 2015-16, the break between Classes B and C decreased eight students, and the break between Classes C and D is six students fewer than the current school year.
The new classification breaks will see 22 schools move up in class for 2016-17, while 17 schools will move down.
Schools recently were notified of their classification. MHSAA Executive Director John E. "Jack" Roberts said schools may not subsequently lower their enrollment figure. However, if revised enrollment figures should be higher and indicate that a school should be playing in a higher class, that school would be moved up.
Schools have the option to play at any higher classification for a minimum of two years, but must exercise the option by April 15 for fall sports, August 15 for winter sports and October 15 for spring sports.
MHSAA tournament sports that will be conducted in traditional classifications for 2016-17 are Basketball and Girls Volleyball. Football will use traditional classifications to determine playoff points.
Sports which will compete in nearly equal divisions are: Baseball, Bowling, Girls Competitive Cheer, Lower Peninsula Cross Country, Lower Peninsula Golf, Ice Hockey, Lacrosse, Lower Peninsula Soccer, Skiing, Softball, Lower Peninsula Swimming and Diving, Lower Peninsula Tennis, Lower Peninsula Track and Field and Wrestling.
Visit the respective sport pages on the MHSAA Website to review the divisional alignments.
The divisions and qualifiers for the MHSAA Football Playoffs will be announced on Selection Sunday, Oct. 23, 2016.
A complete list of school enrollments used to determine classifications for the 2016-17 school year can be found on the Enrollment & Classification page of the MHSAA Website.
Here is a complete list of schools changing classification for 2016-17. (Note: This list does not include schools opting up in class/division for tournaments, which can be found on the Administrators page of the MHSAA Website, under Enrollment and Classification):
Moving Up From Class B to Class A
Coldwater
Detroit International Academy
Melvindale
New Boston Huron
Warren Fitzgerald
Moving Down From Class A to Class B
Haslett
Jackson Northwest
Lansing Eastern
Saginaw Arthur Hill
Moving Up From Class C to Class B
Canton Preparatory
Ferndale University
Flint Academy West
Grand Rapids Wellspring Preparatory
Ithaca
Montague
Sanford Meridian Early College
Tawas
Ypsilanti Arbor Preparatory
Moving Down From Class B to Class C
Allen Park Cabrini
Detroit Central Collegiate
Detroit Benjamin Carson Science & Medicine
Harrison
Jackson Lumen Christi
Jonesville
Warren Michigan Collegiate
Moving Up From Class D to Class C
Detroit Randolph Technical
Detroit Universal Academy
Kimball Landmark Academy
Kingston
Munising
Newberry
Potterville
Rudyard
Moving Down From Class C to Class D
Auburn Hills Oakland Christian
Burton Madison Academy
Lutheran Westland
Mayville
Merrill
Saginaw Michigan Lutheran Seminary
New Postseason Eligible Tournament Schools in 2016-17
Brimley Ojibwe Charter
Center Line Michigan Math & Science
Detroit Cornerstone Leadership & Business
Detroit Delta Prep
Jackson Prep & Early College
Petoskey St. Michael Academy
Southfield Arts & Technology
Enrollment Breaks by Classes – 2016-17
(Number of schools in parentheses)
Class A: 881 and above (187 schools)
Class B: 412 – 880 (188)
Class C: 207 – 411 (188)
Class D: 206 and below (188)
The MHSAA is a private, not-for-profit corporation of voluntary membership by more than 1,400 public and private senior high schools and junior high/middle schools which exists to develop common rules for athletic eligibility and competition. No government funds or tax dollars support the MHSAA, which was the first such association nationally to not accept membership dues or tournament entry fees from schools. Member schools which enforce these rules are permitted to participate in MHSAA tournaments, which attract more than 1.4 million spectators each year.
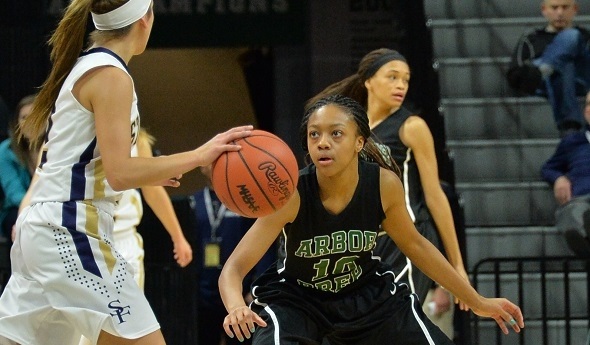
PHOTO: Ypsilanti Arbor Prep won the Class C girls basketball championship earlier this month, but will compete in Class B next season.

Tournament Attendance Tops 1.4 Million
September 17, 2013
By Geoff Kimmerly
Second Half editor
The 2012-13 school year marked the sixth straight that attendance at Michigan High School Athletic Association postseason tournaments totaled more than 1.43 million fans, with attendance at girls tournaments topping 430,000 for the fourth straight year.
Total attendance for 2012-13 was 1,433,356 fans, with 1,002,663 at boys tournaments and 430,693 spectators at girls tournaments. Attendance is kept for all sports except golf, skiing and tennis, for which admission typically is not charged.
Girls tournament attendance first topped 400,000 for a school year in 2008-09, then rose over 430,000 for the first time the following year. Helping fuel the total in 2012-13 was a record crowd of 25,290 for competitive cheer (District, Regional and Final rounds combined), and also a record attendance of 12,508 for the girls and boys bowling tournament.
Total attendance did dip slightly in 2012-13, down from 1,479,152 the year before, a drop of 3.1 percent and the lowest since 2006-07. However, four sports joined cheer and bowling with attendance increases from 2011-12 – girls basketball up 4.8 percent to 166,153 fans, gymnastics up 16.8 percent to 2,290, team wrestling up 1.2 percent to 28,863 and ice hockey up 6.5 percent with 59,037 fans this past season.
Football again was the most attended tournament for the sixth consecutive year with 397,944 fans in 2012 – although that represented a 7.3 percent drop from the 2011 playoffs. However, the Regional (5.6 percent) and Semifinal (6.3) rounds both saw increases in fans from the previous season.
Similarly, boys basketball again was second in attendance with 318,325 fans, despite a 1.4 percent decrease from 2011-12. However, the District, Regional and Quarterfinal rounds showed a combined increase of 2.4 percent over the previous season. Girls basketball attendance increased in every round from 2011-12 for an overall increase of 4.8 percent. The Finals weekend total, including semifinals and championship games for each class, was 19,003, the highest since 1992-93.
Girls lacrosse total attendance dropped 9.7 percent to 5,009 fans, but still totaled its second most as an MHSAA sport and set records for Semifinals (1,027) and Finals (1,171) attendance. Volleyball attendance (96,151) remained above 96,000 fans for the fourth consecutive year despite falling 3.2 percent from its 2011-12 record high. Girls soccer dropped less than half a percent from 2011-12 to 26,836 fans, but set a Regional round record with 10,574.