

MHSAA Attendance Posts 5-Year High
October 6, 2016
By Geoff Kimmerly
Second Half editor
Michigan High School Athletic Association postseason events enjoyed a five-year high in attendance in 2015-16 as two sports saw record fan turnout.
Total attendance for 2015-16 was 1,483,724 fans, an increase of 6.8 percent over the previous year. Girls attendance was 461,419, less than a percent lower than the record set in 2014-15 but still the second largest overall girls turnout since data was first tracked in 1990-91. Boys attendance was 1,022,305 fans, a four-year high helped notably by an increased football crowd last fall. Attendance is kept for all sports except golf, skiing and tennis, for which admission typically is not charged.
The track & field and bowling tournaments, which include attendance for girls and boys events combined, set overall records. Track & field broke a 2011-12 record with 37,773 fans overall and a Regional record of 22,413, and bowling set an overall attendance record for the fifth straight season with 13,919 fans and a Regional record of 9,948.
Football attendance did rebound significantly after a snowy opening weekend in 2014 resulted in the lowest playoff attendance since the 256-team 11-player field was introduced in 1999. Overall football attendance jumped to a three-year high of 389,897, a 25.4 percent increase from the 2014 postseason and with increases seen at the Pre-District, District and Regional levels.
Ten more tournament series showed increases in total attendance over the 2014-15 school year: gymnastics (2.0 percent), softball (2.8 percent), baseball (0.5 percent), girls swimming & diving (12.7 percent), boys swimming & diving (14.6 percent), boys basketball (1.5 percent), girls and boys cross country (combined, 2.1 percent), boys soccer (2.4 percent), team wrestling and individual wrestling all saw increases in overall attendance from the previous school year. Volleyball fell just shy of equaling the previous year’s record, drawing 110,638 fans, a decrease of 293 from the 2014 season but still the second-most since records first were kept in 1990-91. Volleyball did, however, set attendance records at the Regional (26,445) and Semifinal (4,765) levels of the tournament.
Also of note:
• The Boys Basketball Finals draw of 47,407 was a five-year high and a 16.9 percent increase from 2014-15. The Girls Basketball Finals drew 22,301 fans, the most for a Semifinals/Finals weekend since 2004-05 and an increase of 12 percent over 2014-15. Girls basketball’s overall tournament attendance of 169,523 was a decrease of 1.2 percent from 2014-15, but still the second-highest attendance for the sport since 2005-06.
• Overall softball attendance increased for the third straight year to 44,515, the highest total since the record-setting spring of 1994-95.
• Boys Soccer Finals drew 4,906 fans, the most for that event since 2007-08.
• Coming off a record high in 2013-14 and then a sharp decrease the following year, the Ice Hockey Finals rebounded with 10,709 fans, a 7.9 percent increase from the winter before.
The MHSAA is a private, not-for-profit corporation of voluntary membership by more than 1,400 public and private senior high schools and junior high/middle schools which exists to develop common rules for athletic eligibility and competition. No government funds or tax dollars support the MHSAA, which was the first such association nationally to not accept membership dues or tournament entry fees from schools. Member schools which enforce these rules are permitted to participate in MHSAA tournaments, which attract more than 1.4 million spectators each year.
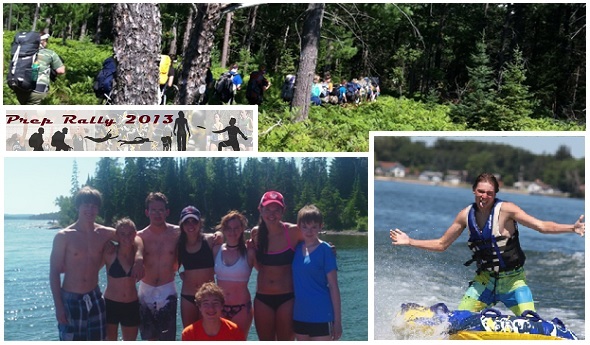
Rally Finalists Prepped for Competition
August 16, 2013
By Geoff Kimmerly
Second Half editor
The MHSAA’s inaugural “Prep Rally” contest was born this spring to help us teach athletes the importance of staying in shape during the offseason – while showing them fun ways to do so.
And like with our MHSAA “Battle of the Fans” contest during the past two winters, we learned a few things from our Prep Rally participants – most notably, that athletes during the school year enjoy staying active during the offseason. And especially if that activity includes a creative challenge or two.
Following are brief stories behind our three finalists for this summer's contest, which was part of the MHSAA’s PLAY (Preparation Lasts All Year) initiative designed to encourage athletes to remain active during the offseason so they are prepared physically and acclimated to warm weather when practice begins in the fall.
Thanks to all who submitted applications – we hope this is just the start of your helping us tell more athletes the best and most enjoyable ways to stay in shape and get ready for competition. The inaugural Prep Rally winner will be announced Monday on Second Half and be awarded tickets to an MHSAA Final of their choice, at which they will be recognized for their accomplishment.
Not surprising given Michigan’s abundance of woods and water, outdoor activities were a dominant theme of the inaugural Prep Rally.
Here’s a look at our finalists:
Beal City: Game Changers
“For many students the summer is simply a time to kick back, relax, hang out on the couch and play video games. However, this is not the case for Beal City athletes,” sophomore Billy Chilman wrote.
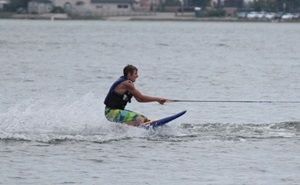 “When we are not training for our championship teams on the field or in the classroom, we are always looking for new ways to stay fit and have fun. Whether it’s going to Coldwater Lake, to boat, knee board, ski or tube, we always seem to find something active to do.”
And that led to ATV tubing.
In essence, a four-wheeler on one bank of a small pond pulls the rider, sitting on a snow sled, across the pond. “It was also a great workout, improving our balance and upper body strength,” Chillman added.
Fenton: Into the Woods
A team that will spend all fall in the pool spends a valuable part of it offseason prep on dry land.
 Fenton girls swimming and diving team journeys away from home leading up to every season. This summer it headed to Pigeon River Country State Forest near Vanderbilt at the northern end of the Lower Peninsula for a three-day “survival trip.”
Plans included a four-mile hike to the first camp, followed by 4-5 mile hikes to each day to a new camp site.
The team also was divided into four smaller squads that competed in challenges as well as setting up camp, building fires and cooking meals.
“The purpose of the trip is to provide some physical conditioning as well as a team-building activity,” Fenton coach Brad Jones wrote in the Tigers’ submission.
Grosse Pointe Woods University Liggett: Crossing the Isle
Seniors Hannah Hodges and Danielle Lorant participate in three sports together during the school year – cross country, hockey and soccer – so staying in shape over the summer is especially key.
 This summer, that included a five-day backpacking trip at Isle Royale National Park as part of a program hosted by Michigan Tech University.
The Knights’ pair hiked 45 miles while carrying 50 pounds of supplies in backpacks. To prepare for the trip, Hodges and Lorant went on weekly hikes closer to home at Stoney Creek Metropolitan Park, Island Lake State Recreation Area and Algonac State Park – which built endurance but also allowed for an opportunity to test their gear.
“Backpacking on Isle Royale granted the chance to interact in nature and connect with other Michigan high school athletes who also participated in the trip, and to stay in good physical condition,” Hodges wrote in her submission.
“This trip demonstrated that there are other ways to stay in shape over the summer besides participating in the sports that we play during the school year.”
Follow the #PrepRally conversation on Facebook and Twitter @MHSAA.