

Tournament Attendance Tops 1.4 Million
September 17, 2013
By Geoff Kimmerly
Second Half editor
The 2012-13 school year marked the sixth straight that attendance at Michigan High School Athletic Association postseason tournaments totaled more than 1.43 million fans, with attendance at girls tournaments topping 430,000 for the fourth straight year.
Total attendance for 2012-13 was 1,433,356 fans, with 1,002,663 at boys tournaments and 430,693 spectators at girls tournaments. Attendance is kept for all sports except golf, skiing and tennis, for which admission typically is not charged.
Girls tournament attendance first topped 400,000 for a school year in 2008-09, then rose over 430,000 for the first time the following year. Helping fuel the total in 2012-13 was a record crowd of 25,290 for competitive cheer (District, Regional and Final rounds combined), and also a record attendance of 12,508 for the girls and boys bowling tournament.
Total attendance did dip slightly in 2012-13, down from 1,479,152 the year before, a drop of 3.1 percent and the lowest since 2006-07. However, four sports joined cheer and bowling with attendance increases from 2011-12 – girls basketball up 4.8 percent to 166,153 fans, gymnastics up 16.8 percent to 2,290, team wrestling up 1.2 percent to 28,863 and ice hockey up 6.5 percent with 59,037 fans this past season.
Football again was the most attended tournament for the sixth consecutive year with 397,944 fans in 2012 – although that represented a 7.3 percent drop from the 2011 playoffs. However, the Regional (5.6 percent) and Semifinal (6.3) rounds both saw increases in fans from the previous season.
Similarly, boys basketball again was second in attendance with 318,325 fans, despite a 1.4 percent decrease from 2011-12. However, the District, Regional and Quarterfinal rounds showed a combined increase of 2.4 percent over the previous season. Girls basketball attendance increased in every round from 2011-12 for an overall increase of 4.8 percent. The Finals weekend total, including semifinals and championship games for each class, was 19,003, the highest since 1992-93.
Girls lacrosse total attendance dropped 9.7 percent to 5,009 fans, but still totaled its second most as an MHSAA sport and set records for Semifinals (1,027) and Finals (1,171) attendance. Volleyball attendance (96,151) remained above 96,000 fans for the fourth consecutive year despite falling 3.2 percent from its 2011-12 record high. Girls soccer dropped less than half a percent from 2011-12 to 26,836 fans, but set a Regional round record with 10,574.
Scholars & Athletes 2019: Class A
By
Geoff Kimmerly
MHSAA.com senior editor
February 18, 2019
By Geoff Kimmerly
Second Half editor
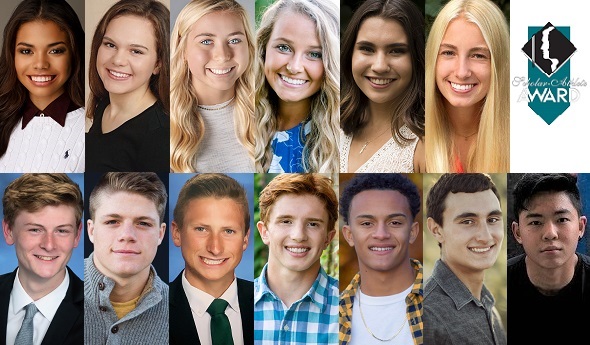
The Michigan High School Athletic Association has selected 13 student-athletes from Class A member schools to receive scholarships through the MHSAA/Farm Bureau Insurance Scholar-Athlete Award program.
 Farm Bureau Insurance, in its 30th year of sponsoring the award, will give $1,000 college scholarships to 32 individuals who represent their member schools in at least one sport in which the Association sponsors a postseason tournament. The first 30 scholarships are awarded proportionately by school classification and the number of student-athletes involved in those classes; also, there are two at-large honorees who can come from any classification.
Students applying for the Scholar-Athlete Award must be carrying at least a 3.5 (on a 4.0 scale) grade-point average and have previously won a letter in a varsity sport in which the Michigan High School Athletic Association sponsors a postseason tournament. Other requirements for the applicants were to show active participation in other school and community activities and produce an essay on the importance of sportsmanship in educational athletics.
Each of the scholarship recipients will be honored at a halftime ceremony during the Class C Boys Basketball Final, March 16, at the Breslin Student Events Center in East Lansing. Commemorative medallions will be given to the finalists in recognition of their accomplishments.
The Class A Scholar-Athlete Award honorees are: Alma Cooper, Okemos; Alexa Easter, Ann Arbor Pioneer; Chloe Idoni, Fenton; Adele Kemp, Greenville; Jade Turner, Traverse City Central; Audrey Whiteside, East Grand Rapids; David DeBacker, Detroit Catholic Central; Matthew George, Novi; Trey Mullins, Novi; Nolan Rich, St. Joseph; Avery Robinson III, Wyoming; Edward Roe, Traverse City Central; and Michael Song, Troy.
Overviews of the scholarship recipients of the Class A Scholar-Athlete Award follow. A quote from each recipient's essay also is included:
 Alma Cooper, Okemos
Playing third season of varsity basketball and played three of varsity volleyball and will run her fourth of track & field this spring. Earned all-league recognition this fall for volleyball and has helped volleyball and basketball teams to District titles and track team to a league championship. Also earned all-conference in track and all-conference all-academic in all three sports. Served as volleyball team captain as a senior and team manager as a sophomore while missing season with an injury. Serving as student body representative at district’s school board meetings and participating in second year of National Honor Society. Serving as clothing drive director for nonprofit supporting victims of human trafficking and was named finalist for community’s “Pass it Forward” award. Finished runner-up for 2017 Miss Michigan Teen USA. Participated in choir/drama for two years, earning all-state honors for choir and singing in Europe for six weeks with Blue Lakes International Choir. Participates in school’s United in Social Progress club and selected to speak at teen girls conference. Selected to attend West Point’s elite leadership seminar; will attend the U.S. Military Academy at West Point and study life science.
Essay Quote: “Sportsmanship in educational athletics teaches young men and women how to celebrate others’ successes and learn from the lessons brought through losses. High school volleyball has allowed me to grow not only as a player but as an individual, respecting others in times of defeat and looking past unimaginable past conflicts to uphold my poise and grace.”
 Alexa Easter, Ann Arbor Pioneer
Ran three seasons of varsity cross country and will run her fourth of track & field this spring. Earned all-state honors in track and helped team to Lower Peninsula Division 1 championship in 2017. Also earned all-state academic honors. Served as cross country co-captain this past fall. Earned AP Scholar Award. Participating in third year of National Honor Society and fourth of student council, serving the latter as part of the philanthropy committee. Served as Link Crew leader and participated in multiple volunteer projects. Co-founded PiHi Engineering Club and served as board member and director of community outreach for WSTEM Club. Earned National Certificate of Distinction from National Center for Women in Information and Technology and received bronze medal in national French contest. Gave talk at Ann Arbor TEDxYouth event. Will attend Barnard College of Columbia University, but remains undecided on what she will study.
Essay Quote: “The moral question was larger than the possibility of a win. How would I feel had I won by playing dirty? What is a victory if it is obtained unfairly? My experience with educational athletics has trained me to see that, even in a high stakes situation in which triumph is just within reach, a win is never worth compromising my values.”
 Chloe Idoni, Fenton
Playing fourth season of varsity basketball and played four of varsity volleyball. Also played varsity soccer as a junior and participated in varsity track & field as a sophomore. Earned all-state recognition in volleyball and basketball and all-league honors all four year of volleyball and first three of basketball, senior season pending. Served as team captain of both teams. Participating in second year of National Honor Society and carries a 3.9 grade-point average. Participating in fourth year of school’s captains club and serving second as part of MHSAA’s Student Advisory Council. Named all-state academic scholar and has participated in a number of volunteer projects including with Salvation Army, Special Olympics and Wreaths Across America. Will attend Ferris State University and study business.
Essay Quote: “In fact, many people do not even realize they are demonstrating good sportsmanship when they do it. Good sportsmanship is not just the conscience acts like telling a player they had a great game or reaching your hand out to help the opponent up, but it is as simple as three values; patience, humility, and respect. These values are not commonly associated with sportsmanship, but will teach you the values you will use for the rest of your life.”
 Adele Kemp, Greenville
Playing fourth season of varsity basketball, ran four of varsity cross country and will participate in fourth of track & field this spring. Earned all-state recognition in basketball and made all-league first team her first three seasons with fourth pending; also earned academic all-state. Served as captain of all three teams multiple seasons. Serving fourth year as class president and participating in fourth year of National Honor Society. Earned recognition for carrying grade-point average above 3.9 through first three years of high school. Earned first place in state DECA competition and placed top 50 in international competition. Served on Greenville Area Youth Advisory Council and currently as Greenville Education Foundation representative. Volunteers in multiple efforts including as youth sports official. Will attend Northwood University and study entertainment, sport & promotion management.
Essay Quote: “Sportsmanship, to me, goes hand-in-hand with signing up for the sport. I fell after finishing a race in track and a girl helped me up. It turned my mood from upset and embarrassed to comforted; everyone should feel that way. During basketball games, every time a player hits the floor around me, I believe that even though we are playing against each other, we are still trying to do our best and achieve similar goals. It is important to extend a helping hand.”
 Jade Turner, Traverse City Central
Participated in three seasons of varsity swimming & diving and three of varsity track & field. Qualified for MHSAA Finals in diving three years and reached championship round as senior in the fall. Served as co-captain of swimming & diving team. Earned AP Scholar with Distinction. Participating in second year of National Honor Society and as secretary, and fourth year studying in school district’s enhanced science, math and technology program. Playing fourth year in orchestra and serving as co-president; earned placement as first-chair violist and advanced to state level as part of quartet and philharmonic orchestra. Participated two years with Academic WorldQuest team, earning fifth-place regional finish. Will attend University of Michigan and study business and history.
Essay Quote: “Sportsmanship in educational athletics has taught me how to make personal connections wherever I go. Not only has this been important in everyday communications, but it will also help me in my professional career. As I move on to college, I plan on studying and finding a career in business, where making connections is vital to success. My athletic career in high school may have been brief, but the impact that sportsmanship has had on me will last a lifetime.”
 Audrey Whiteside, East Grand Rapids
Ran four seasons of varsity cross country and will play her fourth of varsity lacrosse this spring. Ran with her team at four MHSAA Cross Country Finals and helped EGR win Lower Peninsula Division 2 championship in the fall, serving as team captain and earning all-state and all-state academic honors. Helped lacrosse team to reach at least Semifinals all three seasons and win the 2016 Division 2 championship, earning all-state honors multiple seasons and serving as captain and earning all-state academic as a junior. Serving as senior class treasurer, yearbook editor-in-chief and president of yoga club, and started and co-owns local youth lacrosse academy that enrolled 30 athletes its first year. Selected to attend West Michigan Sports Leadership Conference and Jostens Renaissance Leadership Workshop. Will attend Central Michigan University and study nutrition and sports marketing.
Essay Quote: “Sportsmanship is an innate virtue of a true leader. They do not have to talk about it or expect to receive accolades for their actions. Sportsmanship is the humble, unexpected acts that are done every day to make lives better. It doesn’t matter where it happens; it can be in the classroom or on the playing field. Sportsmanship is that intangible asset that stays with you forever.”
 David DeBacker, Detroit Catholic Central
Dove four seasons with the swimming & diving team, winning league championships and qualifying for MHSAA Finals his first three seasons (with fourth pending) and earning all-state all three seasons. Also served as team captain. Named National Merit Scholarship finalist and participating in second year of National Honor Society. Participating in fourth year on school’s academic team and earned Certificate of Special Congressional Recognition for achievement. Selected for Boy Scouts Order of the Arrow, completed Eagle Scout project and served as senior patrol leader. Participating in fourth years of Shamrock Voice debate program and Art Club and served as president of latter for two years. Will attend University of Notre Dame and study architecture.
Essay Quote: “In regards to bad sports, it takes one to know one. Admittedly, I was that kid in gym class who treated every day like it was the Olympics. Looking back on my time in elementary school, I realize how much of a nuisance I was to those around me. Bad sportsmanship brings everyone down. I am ashamed of how I acted in the past, and I use those experiences and memories as a model of how to not behave. As I grew in maturity, I’ve thankfully realized the error of my ways, committing myself to honesty, respect, and courtesy in athletics.”
 Matthew George, Novi
Played two seasons of varsity football and is competing in his fourth of varsity wrestling. Earned multiple all-league and all-District awards for wrestling and was football team’s leading tackler as a senior. Served as captain multiple seasons of wrestling and as football captain for varsity and both subvarsity teams during his four seasons in the sport. Earned Boy Scouts rank of Eagle Scout and served as troop’s senior patrol leader. Participating in a variety of volunteer projects including through church, The Greening of Detroit and Miracle Softball League assisting children with disabilities. Participated in theater as a senior and robotics as a freshman. Will attend University of Michigan and study electrical engineering.
Essay Quote: “When I think of sportsmanship, I think of how a person chooses to react to a situation. When some think of sportsmanship they often refer to how someone treats their opponent. This is an accurate definition, but it’s too narrow. I have come to realize good sportsmanship really starts from within your own team. If you can't treat your teammates positively, you will never do so with your opponents. … Once you embrace positivity there is no longer room for the negative – these are the kind of teams that have good sportsmanship.”
 Trey Mullins, Novi
Ran four seasons of varsity cross country and will participate in fourth of track & field this spring. Served as captain for both teams and earned all-conference, academic all-conference and academic all-state honors for cross country, helping team to high of fourth-place finish at 2016 Lower Peninsula Division 1 Final. Also participates in Novi Unified Sports basketball program mentoring special needs classmates. Serving fourth year on student council, this school year as secretary, and participating in third year of National Honor Society this year as vice president. Also serving as Spanish Club president and fundraising chair for Health Occupations Students of America chapter, earning regional and state recognition for his achievements in the latter. Competes in Mock Trial and as part of school’s Forensic Science team, and named Distinguished Scholar at National Youth Leadership Forum: Law & CSI. Participates in church youth group and various volunteer efforts. Will attend University of Dayton and study accounting.
Essay Quote: “Over the course of our (Unified) season there began a trend when we played other teams in the league: sportsmanship. No matter the intensity or the score of a game, players would give the ball back to one another to shoot if they missed many times. It was obvious to most that we were playing for more than just a game.”
 Nolan Rich, St. Joseph
Ran four seasons of varsity cross country, participated in two of varsity track & field and one of varsity swimming & diving. Earned all-conference honors in track and academic all-state in both cross country and swimming & diving. Helped cross country team to MHSAA Finals in 2016 and served as team captain this past fall. Named National Merit Commended Scholar and has advanced to second round of Michigan Math League test. Serving as class vice president and part of student senate, and participating in second year of National Honor Society. Participating in fourth year of Model United Nations – this year as president – and competed at American Chemical Society US National Chemistry Olympiad. Playing fourth year of marching and concert band, serving as drum major this year. Earned Boy Scouts Star rank. Will attend University of Michigan and study chemical engineering.
Essay Quote: “During the race, the people wearing different colors than me are a target, a goal to pass. But after crossing the finish line, I find that the connection I’ve formed with the guys next to me is not found anywhere else. No matter what jersey someone is wearing, we all push up the same hills, slosh through the same mud, and love the same sport.”
 Avery Robinson III, Wyoming
Played three seasons of varsity tennis and will play third of varsity golf and participate in fourth of track & field this spring; also played two seasons of subvarsity basketball. Earned all-conference and served as team captain in tennis. Received AP Scholar Award. Participating in second year of National Honor Society, this year as president, and also is an officer in school’s Key Club. Playing fourth year in marching and jazz bands; received 1st division rating at district jazz festival all four years of high school and served as marching band drum major this year. Participated in two years of Science Olympiad, earning multiple regional placings. Participating in second year of Alpha Initiative Leadership Group and first of Business Professionals of America. Will attend University of Michigan and study social sciences or pre-law.
Essay Quote: “Sportsmanship is not only a way to respect others, it teaches you how to hold yourself accountable for your actions. Sportsmanship is a way of life. Being a good sport when you win helps develop humility, and being a good sport when you lose develops respect. Sportsmanship goes beyond sports. ... It teaches the youth how to carry themselves and maintain outstanding character that will lead them to success in every aspect of their life.”
 Edward Roe, Traverse City Central
Participating in fourth season of varsity skiing, ran three of varsity cross country and will take part in fourth of track & field this spring; also mountain bikes competitively. Helped cross country team to MHSAA Finals this past fall and served as team’s co-captain. Won 2018 Michigan Cup junior men ski championship. Named National Merit Scholar semifinalist, and Michigan Mathematics Prize finalist three times. Participating in third year of National Honor Society. Playing fourth year in marching, jazz and concert bands and earned top ratings in state solo and ensemble competition. Earned Boy Scout’s designation of Eagle Scout and selected to Order of the Arrow. Served as president of ATLAS Space Explorers chapter and serving as co-president of Students for Environmental Activism club. Will attend Cornell University and study physics and mathematics.
Essay Quote: “Sportsmanship between teammates builds confidence and a will to win, fueling healthy competition and driving athletes to push the limits of what they can do in the face of pain and fatigue. When students find out that they have a greater athletic potential than they ever realized and develop the habit of giving their best effort every day for their sports teams, they are also building the mentality necessary to be a successful student, employee, and citizen.”
 Michael Song, Troy
Played four years of varsity tennis and will participate in second of varsity track & field this spring. Received first or second-team all-state tennis honors the last three seasons and helped team to top-five Finals finishes all four years. Served as team captain. Named AP Scholar and National Merit Commended student. Earned semifinalist award finishing among top 10 percent on U.S. Biology Olympiad exam, and qualified for national Chemistry Olympiad exam. Earned DECA state championship and qualified for international competition, and also made state finals for Health Occupations Students of America competition. Participating in second year of National Honor Society. Serving fourth year as school representative for Council of Asian Pacific Americans. Played solo piano performance at Carnegie Hall in New York. Will attend University of Michigan and study business and finance.
Essay Quote: “In seasons where underlying hatred abounded, I dropped splashes of change each time I entered the court. Small talk and passing compliments during matches eased tensions, breaking down the barriers between teams. Often times, I came out of matches happy – regardless of a win or loss – to have a new friend off the court. Moments like these have ingrained into my memory and make me thankful for the dedication I've put into tennis.”
Other Class A girls finalists for the Scholar-Athlete Award were Anna Scott, Ann Arbor Huron; EmJ Rennich, Ann Arbor Pioneer; McKenna Evans, Battle Creek Lakeview; Ariella Cuellar, Bay City Central; Emily Moriartey, Davison; Ellie Timmons, Davison; Lexi Loehfelm, Grand Rapids Forest Hills Northern; Addison Irish, Hudsonville; Maya Albright, Midland; Mariella Simoncini, Northville; Claire Wan, Northville; Yveloute Rea, Petoskey; Elizabeth Bulat, Rochester; Megan Corbe, St. Joseph; Cailey Rooker, St. Joseph; Madeline Purvis, Troy Athens; Madeline Rehm, White Lake Lakeland; and Megan Morehouse, Zeeland East.
Other Class A boys finalists for the Scholar-Athlete Award were: Colin Czajkowski, Brownstown Woodhaven; Joseph Hardenbergh, Detroit Catholic Central; Keegan Koehler, Detroit Catholic Central; Ryan Marra, Detroit Catholic Central; Jack Killian, Fenton; Noah Stout, Grand Rapids Forest Hills Central; Ryan Downey, Grosse Pointe South; Michael Willard, Grosse Pointe South; Samuel Martens, Holland; Carson Currie, Lapeer; Noah Kinnucan, Muskegon Mona Shores; Daniel McLaughlin, Northville; Carson Krumm, Okemos; Harrison Poeszat, Orchard Lake St. Mary's; Parker Raymond, Rochester Adams; John Tisch, Utica; and Trent Farquhar, White Lake Lakeland.
The Class C and Class D scholarship award recipients were announced Feb. 5, and the Class B honorees were announced Feb. 12.
Farm Bureau Insurance of Michigan was founded in 1949 by Michigan farmers who wanted an insurance company that worked as hard as they did. Those values still guide the company today and are a big reason why it is known as Michigan’s Insurance Company, dedicated to protecting the farms, families, and businesses of this great state. Farm Bureau Insurance agents across Michigan provide a full range of insurance services—life, home, auto, farm, business, retirement, Lake Estate®, and more—protecting nearly 500,000 Michigan policyholders.
The MHSAA is a private, not-for-profit corporation of voluntary membership by more than 1,500 public and private senior high schools and junior high/middle schools which exists to develop common rules for athletic eligibility and competition. No government funds or tax dollars support the MHSAA, which was the first such association nationally to not accept membership dues or tournament entry fees from schools. Member schools which enforce these rules are permitted to participate in MHSAA tournaments, which attract more than 1.4 million spectators each year.
-0-