

Use of Participate Fees Falls in 2016-17
July 20, 2017
By Geoff Kimmerly
Second Half editor
Just under half of high schools responding to an annual Michigan High School Athletic Association survey assessed participation fees to help fund interscholastic athletics in 2016-17, making it the first school year since 2009-10 that fewer than 50 percent of respondents reported not charging student-athletes to play sports.
The survey, completed by 557 high schools – or 74 percent of the MHSAA membership – showed 49.7 percent charged participation fees, down from 51.5 percent in 2015-16.
There were 750 senior high schools in the MHSAA membership in 2016-17. This was the 13th survey of schools since the 2003-04 school year, when members reported fees were charged by 24 percent of schools. The percentage of member schools charging fees crossed 50 percent in 2010-11 and reached a high of 56.6 percent in 2013-14.
Class A schools remained the largest group charging fees, as 70 percent of respondents did so in 2016-17 and at least 70 percent have charged for the last five years. Class B schools ticked up to 52 percent charging fees, but Class C (42 down from 49 percent) and Class D (35 down from 38 percent) both reported lower percentages of schools charging fees.
Charging a standardized fee for each team on which a student-athlete participates – regardless of the number of teams – remains the most popular method among schools assessing fees, with that rate at 44 percent of schools that assessed fees for the second straight year. Schools charging a one-time standardized fee per student-athlete rose slightly, from 27 to 31 percent over the last year. Also for the second straight year, the survey showed a slight decrease in schools assessing fees based on tiers of the number of sports a student-athlete plays (for example, charging a larger fee for the first team and less for additional sports) and also a slight decrease in fees being assessed based on the specific sport being played.
The amounts of most fees also remained consistent from 2015-16 to 2016-17: the median annual maximum fee per student at $150, the median annual maximum family fee at $300 and the median per-team fee at $75 – all for at least the third straight year. The median fee assessed by schools that charge student-athletes once per year increased again, but only $5 to $125 after showing a $20 increase per student-athlete between 2014-15 and 2015-16.
The survey for 2016-17 and surveys from previous years can be found on the MHSAA Website by clicking here.
The MHSAA is a private, not-for-profit corporation of voluntary membership by more than 1,400 public and private senior high schools and junior high/middle schools which exists to develop common rules for athletic eligibility and competition. No government funds or tax dollars support the MHSAA, which was the first such association nationally to not accept membership dues or tournament entry fees from schools. Member schools which enforce these rules are permitted to participate in MHSAA tournaments, which attract more than 1.4 million spectators each year.
Scholars and Athletes 2016: Class A
By
Geoff Kimmerly
MHSAA.com senior editor
February 15, 2016
By Geoff Kimmerly
Second Half editor
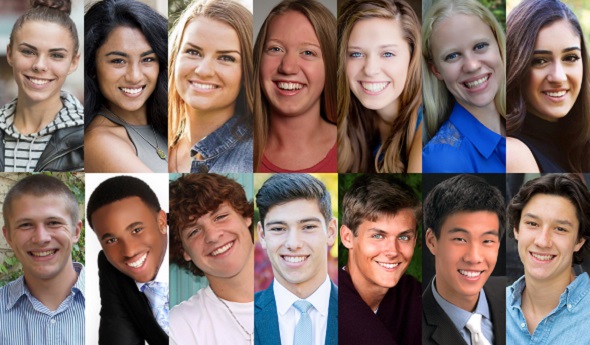
The Michigan High School Athletic Association has selected 14 student-athletes from Class A member schools to receive scholarships through the Farm Bureau Insurance Scholar-Athlete Award program.
 Farm Bureau Insurance, in its 27th year of sponsoring the award, will give $1,000 college scholarships to 32 individuals who represent their member schools in at least one sport in which the Association sponsors a postseason tournament. The first 30 scholarships are awarded proportionately by school classification and the number of student-athletes involved in those classes; also, there are two at-large honorees who can come from any classification.
Students applying for the Scholar-Athlete Award must be carrying at least a 3.5 (on a 4.0 scale) grade-point average and have previously won a letter in a varsity sport in which the Michigan High School Athletic Association sponsors a postseason tournament. Other requirements for the applicants were to show active participation in other school and community activities and produce an essay on the importance of sportsmanship in educational athletics.
Each of the scholarship recipients will be honored at halftime ceremonies of the Class C Boys Basketball Final game March 26 at the Breslin Student Events Center in East Lansing. Commemorative medallions will be given to the finalists in recognition of their accomplishments.
The Class A Scholar-Athlete Award honorees are: Drew Blakely, Richland Gull Lake; Kobe Burse, Muskegon Mona Shores; Riley Costen, Hudsonville; Zaven Dadian, Birmingham Seaholm; Kayla Dobies, Macomb Dakota; Kelsey Emmanuel, Lowell; Lars Hornburg, Traverse City Central; Marie Lachance, East Grand Rapids; Anna Laffrey, East Grand Rapids; Allia Marie McDowell, Farmington Hills Mercy; Jason Ren, Canton; Easton Schultz, East Grand Rapids; Genevieve Soltesz, Mattawan; and Mallak Taleb, Dearborn Heights Crestwood.
Overviews of the scholarship recipients of the Class A Scholar-Athlete Award follow. A quote from each recipient's essay also is included:
Kayla Dobies, Macomb Dakota
Ran four seasons of varsity cross country, will run her fourth of varsity track and field and played varsity basketball as a sophomore. Owns school records in high jump, as part of 3,200 and 1,600-meter relays, and also for fastest cross country 5K. Served as cross country team’s captain three years and made the MHSAA Finals twice. Qualified for the last three MHSAA Track & Field Finals, placing twice. Earned academic all-state in cross country twice and track and field three times. Serves as treasurer in her second year of National Honor Society, is in her third year as a Joyce Ivy Foundation fellow and member of the Mu Alpha Theta mathematics honors society. Also has participated in Science Olympiad and First Robotics. Mentors middle school track athletes and created and directs a youth summer track and field camp. Will attend Princeton University and study neuroscience with aspirations of becoming a neurosurgeon.
Essay Quote: “For most athletes, sportsmanship is high-fiving your opponents at the end of a game. Constantly repeating, ‘good game,’ just to be polite. … Sportsmanship means much more than a pat on the back, more than a ‘good game.’ Sportsmanship is showing love for the people who face the same hardships as you, regardless of what team they play for.”
Kelsey Emmanuel, Lowell
Played two years of varsity volleyball, will run her third of varsity track and field this spring, ran two seasons of varsity cross country and played two seasons of subvarsity basketball. Served as volleyball captain in the fall and junior varsity basketball captain as a sophomore, and earned sportsmanship awards in two sports. Participating in third year of Lowell Youth Advisory Council, this year as treasurer, and is secretary in her second year of student council. Also is in her second year of National Honor Society and fourth of Lady Arrows Varsity Club, and was part of a State Farm “Celebrate my Drive” safe driving campaign in 2013 that placed among the top 50 nationally. Participated in her school’s musical and Christmas play as a junior. Will attend New York University and study international relations.
Essay Quote: “A person who is able to take away a lesson from a loss is a teammate who shows dedication to lead others toward improvement and reaching their goals. When someone notices good camaraderie amongst teammates, there is no question that there is an athlete encouraging and positively leading them behind the scenes. Sportsmanship is like an identical twin to leadership. When an athlete represents sportsmanship on the field, she is also representing herself as a role model and leader in her community and school.”
Marie Lachance, East Grand Rapids
Swam four seasons on varsity, helping East Grand Rapids to MHSAA team titles in 2013 and 2014; will compete in her second season as a varsity pole vaulter this spring. Earned all-state honorable mention in swimming as a sophomore and junior and made the MHSAA Finals in track and field as a junior. Served or will serve as captain of both teams as a senior. Also coached We the People constitutional debate team that was first in state and eighth nationally. Serves as co-president of National Honor Society chapter and has held leadership positions as part of a number of school groups. Earned AP Scholar Award, Harvard Book Award and is a Joyce Ivy Foundation fellow. Founded and organized a TEDx event at her school and participated in both the Brown University Leadership Institute and Eileen Fisher Leadership Institute. Volunteers with Orchard Hills Swim Team youth program, East Grand Rapids recreation department and Grand Rapids’ Comprehension Therapy Center. Will attend Brown University and study business with a concentration in entrepreneurship and organizations.
Essay Quote: “I am a swift swimmer. I am a fierce pole vaulter. But above all, I am an incredible teammate. Although there are no medals or podium for this feat, throughout my 11 years of being a competitive swimmer, I have learned that displaying sportsmanship is the true reward of competitive athletics.”
Anna Laffrey, East Grand Rapids
Ran four seasons of varsity cross country and will run third of varsity track and field this spring; also played junior varsity lacrosse. Qualified for the MHSAA Finals her final three seasons in cross country and the last two in track. Earned all-state on a 3,200-meter relay Finals champion in 2015 and helped the cross country team to a Finals runner-up finish in the fall. Captained the cross country team and will captain the track and field team this spring. Served as opinion editor and then editor-in-chief of student newspaper, winning multiple awards from the Michigan Interscholastic Press Association, and was public relations head for school’s TEDx event committee. Coached We the People constitutional debate team that was first in state and eighth nationally. Served multiple leadership roles for school’s Leadership & Youth Development group. Selected as only member of graduating class to her school district’s foundation board. Is undecided where she will attend college but intends to study journalism.
Essay Quote: “I realized that the team from down the street had made me a stronger person. (It) had taught me to face defeat with optimism and combat failure with hard work. More importantly, however, it had taught me integrity. … Great rivalries aren’t made from trash talk and aggression. Rather, they’re fostered from mutual respect and shared passion: epitomizing the characteristics of sportsmanship.”
Allia Marie McDowell, Farmington Hills Mercy
Will play her third full season of varsity soccer this spring and played three seasons on the school’s varsity field hockey team; also played subvarsity basketball as a freshman. Helped her soccer team to Regional Finals in 2013 and 2014 and earned all-area honors last spring. Served as varsity soccer captain and also captain of soccer and field hockey junior varsities. Served as editor-in-chief of school newspaper that received the highest honor by the Michigan Interscholastic Press Association, and also won individual awards. Selected for National Honor Society and is a member of the Mercy Junior Classical League and a number of additional school clubs. Has volunteered throughout high school for Our Lady of Victory events, Detroit Red Wings games and camps and St. Joseph Mercy Hospital/The Farm at St. Joe’s projects, taking leadership roles with all three organizations. Is undecided where she will attend college but will study journalism and business.
Essay Quote: “Sportsmanship gets a lot of lip service by players. They talk about being good sports, and then sometimes they aren’t. They talk about poor attitude of other teams, but sometimes don’t encourage their own teammates on the field. … But high school athletes are scholar-athletes. That means athletics are meant to be an extension of learning. And sportsmanship is something that is taught.”
Genevieve Soltesz, Mattawan
Ran four seasons of varsity cross country and will play her fourth of varsity softball this spring; also played subvarsity basketball as a freshman. Played key roles on softball teams that won an MHSAA championship in 2013 and made the Semifinals in 2015, earning all-state in that sport as a junior and all-division honors in cross country. Served as captain of both varsity teams. Ranks first academically in her school’s graduating class and scored a perfect score on her ACT college entrance exam. Earned AP Scholar with Distinction and was named National Merit Award semifinalist. Participating in National Honor Society for third year and is president of Mattawan High School History Club. Volunteers with local food drive and elementary school Battle of the Books, and has served as a youth softball instructor and high school peer tutor. Will attend Columbia University in New York and study operations research and financial engineering.
Essay Quote: “As vital as sportsmanship is, it is not innate; it must be learned over time. Unfortunately, in the midst of competition, athletes sometimes abandon this skill in favor of anger or selfishness. It is the ability to resist this urge that shows true sportsmanship. … By participating in high school sports, athletes are able to witness and practice sportsmanship in ways that their peers are not.”
Mallak Taleb, Dearborn Heights Crestwood
Ran two seasons of varsity cross country as a freshman and sophomore, also played varsity basketball as a sophomore, and will play her fourth season of varsity soccer this spring. Has served as captain of soccer team since sophomore season and also was basketball captain that year. Helped soccer team to back-to-back league championships and qualified for Regional competition in cross country as a freshman. Participating in fourth year of student congress and as president, and serves on the board of directors for her school’s Students Against Destructive Decisions chapter. Also participates in National Honor Society, Link Crew and was co-founder of Books for a Benefit program to assist needy schools; also launched multiple fundraisers to assist needy and refugees. Earned various academic achievement and service and leadership awards, and was selected for the American Legion Auxiliary Girls State program and nominated for the U.S. National Chemistry Olympiad team. Has not chosen where she’ll attend college, but will study biomedical engineering.
Essay Quote: “The value of sportsmanship … includes the sacrifices you make for your teammates and the examples you serve to those who look up to you. For me, sportsmanship is an act – a decision to encourage, inspire, motivate and respect others and opponents.
Drew Blakely, Richland Gull Lake
Played three seasons of varsity baseball and will play his fourth this spring. Earned all-state honors his first three seasons including making the Dream Team, which includes the best regardless of division, in 2015. Served as team captain last season. Participating in National Honor Society for the second year and also his second year in the school’s PAL program to mentor and tutor middle school students; served on the school’s Captain’s Council as a junior. Earned a 4.1 grade-point average and became the only freshman in school history to score a 5 on the AP U.S. History exam. Volunteers as part of the baseball program, his church and with middle school students with disabilities and also with Relay for Life. Chosen to speak at local church and Rotary Club. Will attend the University of Virginia and study kinesiology.
Essay Quote: “I have learned that when you encourage your teammates and show dignity to your opponents, your performance tends to improve as well. Many players look up to me because of my talent, but I think it is more important they look up to me for my character on and off the field. … I want to leave a legacy for my sportsmanship and have my talent be nothing more than an additional bonus.”
Kobe Burse, Muskegon Mona Shores
Played three seasons of varsity football, four of varsity basketball and will participate in his third of varsity track and field this spring. Earned all-league honors in football and basketball and all-state honorable mention as well in basketball; captained both teams including the basketball team his final two seasons. Helped football team to three playoff appearances and an appearance in the 2014 Division 2 Final, and qualified for the MHSAA Finals for track and field as a junior. Has participated with Kids Food Basket and as a reader to his district’s elementary school students the last four years and also as a peer tutor as a senior. Also participates with his church youth group and serves as instructor for junior basketball and youth football programs. Will attend Miami University in Ohio and study psychology.
Essay Quote: “Participation in sports – or any group, for that matter – teaches a number of lessons. Whether it is time management, hard work, or perseverance, student-athletes – upon walking across that graduation stage – seem to take away more from their time in athletics than they give. … More than anything else, my participation in educational athletics has taught me how to be a sportsmanlike teammate – an emphatic partner, encouraging leader and selfless individual to lean upon throughout all phases of competition.”
Riley Costen, Hudsonville
Played two seasons of varsity tennis and two of varsity basketball and also played subvarsity baseball and football. Earned all-league honors in tennis as a junior after winning a flight championship and helped his basketball team to a District title in 2015. Served as captain for both varsity teams and also his freshman football team. Earned AP Scholar with Honor award and is a member of his school’s Eagle Gold Renaissance academic program; ranks third in graduating class academically with a 4.231 grade-point average. Participating on student council for fourth year and with National Honor Society for second, and also is a Links mentor and member of his church youth group. Selected twice for interview team for new teacher hires. Serves as community education coach and has umpired baseball and softball games; also initiated and planned a community-wide fundraiser that raised more than $20,000 for a young boy with cancer. Is undecided where he will attend college and what field of study he will pursue.
Essay Quote: “I believe if athletes realize the true honor it is to be called a student-athlete, the participants themselves and whole programs will become more successful. When I say ‘successful,’ I’m not talking about the win/loss record. Rather, I’m talking about displays of good character, mutual respect between teammates, opponents and officials; honesty, integrity and discipline; or simply, the core values of sportsmanship.”
Zaven Dadian, Birmingham Seaholm
Played four seasons of varsity tennis and will play his third of varsity golf this spring; also played subvarsity basketball as a freshman. Earned all-state honors in tennis and won three individual Regional championships while helping his team to four Regional team titles; served as captain of the tennis team two seasons. Earned golf team’s Sportsmanship Award. Playing in fourth year of band and as principle chair for concert and symphony, receiving Division I ratings for solo and ensemble for piano; also has served two years as marching band section leader. Participating in second year of National Honor Society and iMatter for Kids, and has been a member all four years of the Armenian Christian Youth Organization of America. Participates in various service projects through his church and received an ACYOA service award. Will attend University of Michigan and study business.
Essay Quote: “Sportsmanship is not always about winning the match, but how you conduct yourself both in times of victory and defeat. I play each match knowing that whatever the outcome may be, I will hold my composure and be the first man at the net to shake hands. When people think of me, they may not remember whether I won the big match, but that I was honorable.”
Lars Hornburg, Traverse City Central
Played two seasons of varsity soccer and competed four seasons on varsity ski team; also participated in varsity track and field as a sophomore. Earned a Regional championship and finished MHSAA Finals runner-up individually in skiing and helped his soccer team to a District title. Earned all-league honors in both sports and all-state in skiing and also served as captain of both soccer and ski teams. Named Junior Olympian three times by U.S. Ski Association Rocky/Central division. Participating in second year of National Honor Society and fourth in school’s select choir, for which he is a section leader; earned top scores at state choral festival. Earned AP Scholar award has participated three years in his district’s Sci-Ma-Tech advanced science/math/technology program, earning a second place at a regional science symposium. Also is participating for third year in G.1.F.T. student-run community charity. Will attend Harvard University and intends to study environmental science.
Essay Quote: “Sportsmanship is about respect for others as individuals in the face of competition, recognizing not only our opponents’ but also our teammates’ unique personal challenges and strengths. Just as we shape each other and hone each other on the field, true sportsmen look to build each other up on and off the field.”
Jason Ren, Canton
Played four seasons of varsity soccer and helped his team to an MHSAA championship in 2014 and runner-up finish in 2015. Earned all-state honorable mention in addition to all-league and other honors and received scholar-athlete honors three seasons. Served as co-captain as a senior in the fall. Participating in second year of National Honor Society and currently as president, and is also in his second year as co-captain of the school’s Math Olympiad team. Earned AP Scholar and Scholar with Distinction awards and is a National Merit Award semifinalist. Also earned certificate of distinction from American Mathematics Competition and honorable mention from the Michigan Math Prize Competition as a two-time finalist. Provides ACT/SAT instruction and also contributes in his community as a member of Key Club and as a volunteer soccer referee for Special Olympics and youth soccer coach. Is undecided where he will attend college but will study computer science and business.
Essay Quote: “The camaraderie developed among teammates and the life lessons taught by educational athletics outweigh winning or losing by a long shot. Ultimately, educational athletics give us a unique opportunity to grow as people – developing, understanding and exhibiting sportsmanship are the best ways to take full advantage of that opportunity.”
Easton Schultz, East Grand Rapids
Ran three seasons of varsity cross country and will run third of varsity track and field; also played subvarsity basketball and football. Helped cross country team to best two MHSAA Finals finishes in school history. Earned all-league honorable mention as a junior and academic all-state three years. Served or will serve as captain of both cross country and track and field varsity teams. Participating in fourth year of student council and is a member of National Honor Society. Earned AP Scholar with Distinction; also honored by the Native American Financial Officers Association and received the Tribal Economic Development National Leader Award. Works as a paid intern for his tribe, the Nottawaseppi Huron Band of the Potawatomi, and hosted a youth camp to teach tribal history and cultural arts and crafts. Raised $5,000 for the American Cancer Society over five years as captain of Relay for Life team. Will attend Harvard University and study economics with a dual study of finance at the Massachusetts Institute of Technology Sloan School of Management.
Essay Quote: “Through encouragement from a rival and my assistance paid in return, my seemingly dreary senior season became an enjoyable learning experience. Before my injury, I had downplayed the importance of sportsmanship, but I now recognize its vital role in the character development of young adults and hope that other high school athletes will be as positively affected by sportsmanship as I was.”
Other Class A girls finalists for the Scholar-Athlete Award were: Clare Brush, Ann Arbor Pioneer; Catherine Markley, Birmingham Seaholm; Lauren McLeod, Birmingham Seaholm; Cameron Peek, Caledonia; Jaime Freas, Dearborn Edsel Ford; Sarah Hartshorn, Dearborn Edsel Ford; Mackenzie Cole, East Grand Rapids; Brianna Costigan, Fenton; Ally Stapleton, Grand Rapids Forest Hills Central; Catherine Stapleton, Grand Rapids Forest Hills Central; Meredith Howe, Grand Rapids Forest Hills Northern; Erin Armbruster, Grosse Pointe North; Lindsey Rudden, Marquette; Olivia Arends, Mt. Pleasant; Mary Catherine McLaughlin, Northville; Ellen Wegener, Rochester; and Jennifer Eaton, St. Johns.
Other Class A boys finalists for the Scholar-Athlete Award were: Jack Eisentrout, Ann Arbor Pioneer; Nathan Lazor, Birmingham Groves; Brendan Oosse, East Grand Rapids; Jared Char, Farmington Hills Harrison; Charles R. Perkins Jr., Farmington Hills Harrison; Santino J. Guerra, Flint Kearsley; Garrett Farney, Grandville; Noah Andrew Weigle, Grandville; Jeremy Tervo, Hartland; Eric Mettetal, Howell; Daniel Karel, Hudsonville; Traver Parlato, Kalamazoo Loy Norrix; Kevin Hansen, Lake Orion; Alexander Oquist, Livonia Stevenson; Benjamin G. Cole, Marquette; Joseph Weber, Marquette; Kyle Jones, Swartz Creek.
The Class C and D scholarship award recipients were announced Feb. 2, and the Class B honorees were announced Feb. 9. All can be found on the MHSAA Website by clicking the “Scholar-Athlete” link at the bottom of the page under “Students.”
Farm Bureau Insurance of Michigan was founded in 1949 by Michigan farmers who wanted an insurance company that worked as hard as they did. Those values still guide the company today and are a big reason why it is known as Michigan’s Insurance Company, dedicated to protecting the farms, families, and businesses of this great state. Farm Bureau Insurance agents across Michigan provide a full range of insurance services—life, home, auto, farm, business, retirement, Lake Estate®, and more—protecting nearly 500,000 Michigan policyholders.
The MHSAA is a private, not-for-profit corporation of voluntary membership by more than 1,400 public and private senior high schools and junior high/middle schools which exists to develop common rules for athletic eligibility and competition. No government funds or tax dollars support the MHSAA, which was the first such association nationally to not accept membership dues or tournament entry fees from schools. Member schools which enforce these rules are permitted to participate in MHSAA tournaments, which attract more than 1.4 million spectators each year.