

2014 Week 5 Football Playoff Listing
September 23, 2014
By Geoff Kimmerly
Second Half editor
Here is a list of Michigan High School Athletic Association football playing schools, displaying their win-loss records and playoff averages through the fourth week of the season.
Schools on this list are in enrollment order for 11-player teams, with 8-player teams ordered by playoff average. An asterisk (*) beside a record indicates a team has eight or fewer games scheduled. A caret (^) beside a school’s name indicates a team is one win away from playoff qualification.
Those schools with 11-player teams with six or more wins playing nine-game schedules, or five or more wins playing eight games or fewer, will qualify for the MHSAA Football Playoffs beginning Oct. 31. Schools with 5-4, 4-3 or 4-4 records may qualify if the number of potential qualifiers by win total does not reach the 256 mark. Schools with six or more wins playing nine-game schedules or five or more wins playing eight games or fewer may be subtracted from the field based on playoff average if the number of potential qualifiers exceeds the 256 mark.
Once the 256 qualifying schools are determined, they will be divided by enrollment groups into eight equal divisions of 32 schools, and then drawn into regions of eight teams each and districts of four teams each.
Those schools with 8-player teams will be ranked by playoff average at season’s end, and the top 16 programs will be drawn into regions of eight teams each for the playoff in that division, which also begins Oct. 31.
To review a list of all football playoff schools, individual school playoff point details and to report errors, visit the Football page of the MHSAA Website.
The announcement of the qualifiers and first-round pairings for both the 11 and 8-player playoffs will take place on Oct. 26 on the Selection Sunday Show on FOX Sports Detroit. The playoff qualifiers and pairings will be posted to the MHSAA Website following the Selection Sunday Show.
11-Player Playoff Listing
1. Macomb Dakota, 2814, 3-1, 72.750
2. Sterling Heights Stevenson, 2767, 3-1, 66.250
3. Clarkston, 2742, 4-0, 98.000
4. Grand Blanc, 2668, 3-1, 66.500
5. East Kentwood, 2592, 4-0, 90.000
6. Rockford, 2555, 4-0, 98.000
7. Dearborn Fordson, 2411, 4-0, 88.000
8. Northville, 2298, 3-1, 64.750
9. Holland West Ottawa, 2293, 3-1, 74.500
10. Canton, 2289, 3-1, 66.500
11. Detroit Cass Tech, 2277, 4-0, 86.000
12. Plymouth, 2116, 3-1, 62.750
13. Lapeer, 2112, 4-0, 82.000
14. Hartland, 2007, 3-1, 72.000
15. Monroe, 1992, 3-1, 66.750
16. Grand Haven, 1960, 3-1, 70.500
17. West Bloomfield, 1929, 3-1, 66.750
18. Westland John Glenn, 1872, 3-1, 62.750
19. Warren Mott, 1870, 3-1, 70.500
20. Oxford, 1864, 4-0, 94.000
21. Livonia Stevenson, 1848, 3-1, 58.250
22. Saline, 1844, 3-1, 68.500
23. Walled Lake Central, 1815, 3-1, 68.500
24. Hudsonville, 1759, 3-1, 64.750
25. Waterford Mott, 1738, 3-1, 66.750
26. Livonia Churchill, 1696, 4-0, 98.000
27. Flint Carman-Ainsworth, 1568, 3-1, 64.500
28. Warren DeLaSalle, 1562, 3-1, 52.750
29. Detroit Western International, 1521, 3-1, 54.500
30. Detroit Martin Luther King, 1507, 4-0, 88.000
31. Walled Lake Western, 1502, 4-0, 88.000
32. Traverse City Central, 1490, 3-1, 66.250
33. Oak Park, 1486, 3-1, 66.750
34. Brownstown Woodhaven, 1484, 4-0, 92.000
35. Southgate Anderson, 1374, 3-1, 60.750
36. Dearborn Edsel Ford, 1356, 3-1, 66.250
37. Wyandotte Roosevelt, 1351, 3-1, 72.500
38. Detroit East English, 1345, 3-1, 66.750
39. Portage Northern, 1345, 3-1, 71.833
40. Port Huron, 1336, 3-1, 72.750
41. Ypsilanti Community, 1300, 3-1, 66.250
42. Birmingham Brother Rice, 1298, 4-0, 96.000
43. Garden City, 1290, 3-1, 50.750
44. Muskegon Mona Shores, 1274, 3-1, 74.750
45. Birmingham Groves, 1270, 4-0, 84.000
46. Berkley, 1265, 4-0, 80.000
47. Flushing, 1260, 3-1, 70.250
48. Midland Dow, 1255, 4-0, 90.000
49. South Lyon, 1254, 4-0, 94.000
50. Southfield, 1239, 3-1, 68.750
51. Farmington Hills Harrison, 1212, 3-1, 68.500
52. Fenton, 1181, 4-0, 92.000
53. Farmington, 1178, 3-1, 66.500
54. Grand Rapids Northview, 1177, 3-1, 62.500
55. Warren Woods Tower, 1175, 4-0, 86.000
56. Muskegon, 1157, 4-0, 98.000
57. Lowell, 1145, 4-0, 78.000
58. Greenville, 1130, 3-1, 52.250
59. Gibraltar Carlson, 1129, 3-1, 62.500
60. Grand Rapids Forest Hills Northern, 1113, 4-0, 86.000
61. Holland, 1109, 3-1, 60.250
62. Marquette, 1090, 3-1, 58.100
63. St. Johns, 1088, 4-0, 88.000
64. Byron Center, 1085, 3-1, 62.750
65. Allen Park, 1069, 3-1, 68.750
66. Auburn Hills Avondale, 1056, 3-1, 58.500
67. Orchard Lake St. Mary's, 1054, 4-0, 88.000
68. Mt. Pleasant, 1050, 3-1, 70.750
69. St. Joseph, 1028, 3-1, 70.750
70. Petoskey, 965, 3-1, 60.750
71. Romulus, 950, 3-1, 50.500
72. Riverview, 935, 4-0, 84.000
73. DeWitt, 930, 4-0, 92.000
74. Gaylord, 927, 4-0, 74.000
75. Linden, 921, 3-1, 60.750
76. Detroit Mumford, 919, 3-1, 56.250
77. Cedar Springs, 910, 3-1, 52.250
78. Grand Rapids Christian, 895, 3-1, 62.750
79. Stevensville Lakeshore, 887, 4-0, 97.333
80. Niles, 885, 3-1, 60.500
81. Carleton Airport, 879, 3-1, 52.750
82. Coldwater, 876, 4-0, 72.000
83. New Boston Huron, 867, 3-1, 58.750
84. Warren Fitzgerald, 857, 3-1, 60.750
85. Zeeland West, 850, 4-0, 74.000
86. Dearborn Divine Child, 848, 3-1, 57.583
87. St. Clair, 844, 3-1, 60.750
88. Edwardsburg, 839, 3-1, 58.750
89. Chelsea, 838, 3-1, 70.500
90. Plainwell, 812, 3-1, 56.500
91. Detroit Denby, 800, 3-1, 68.500
92. Vicksburg, 794, 4-0, 80.000
93. Bloomfield Hills Cranbrook-Kingswood, 790, 3-1, 50.500
94. Cadillac, 747, 4-0, 88.000
95. Goodrich, 737, 3-1, 64.750
96. Dearborn Heights Robichaud, 717, 4-0, 64.667
97. Yale, 716, 3-1, 50.750
98. Muskegon Orchard View, 662, 3-1, 52.250
99. Williamston, 659, 4-0, 80.000
100. Paw Paw, 657, 3-1, 56.750
101. Lansing Sexton, 652, 4-0, 98.000
102. Whitehall, 644, 4-0, 72.000
103. Kalamazoo Hackett, 635, 4-0, 64.000
104. Richmond, 630, 4-0, 80.000
105. Wyoming Kelloggsville, 610, 3-1, 50.750
106. Wyoming Godwin Heights, 609, 4-0, 58.000
107. Saginaw Swan Valley, 602, 4-0, 64.000
108. Birch Run, 575, 4-0, 72.000
109. Remus Chippewa Hills, 567, 4-0, 80.000
110. Marine City, 553, 4-0, 74.000
111. Flint Powers Catholic, 553, 3-1, 66.500
112. Freeland, 549, 4-0, 80.000
113. Ann Arbor Gabriel Richard, 545, 3-1, 46.750
114. Stanton Central Montcalm, 539, 3-1, 54.250
115. Portland, 538, 3-1, 62.750
116. Menominee, 532, 4-0, 81.467
117. Detroit University Prep, 530, 3-1, 52.750
118. River Rouge, 530, 3-1, 62.000
119. Frankenmuth, 528, 3-1, 54.750
120. Gladwin, 528, 3-1, 48.750
121. Ida, 527, 4-0, 66.000
122. Hopkins, 522, 3-1, 52.250
123. Lansing Catholic, 515, 4-0, 78.000
124. Almont, 512, 4-0, 64.000
125. Newaygo, 506, 3-1, 52.750
126. Olivet, 505, 3-1, 48.000
127. Muskegon Oakridge, 501, 3-1, 46.750
128. Onsted, 499, 3-1, 40.750
129. Chesaning, 480, 3-1, 52.750
130. Manistee, 479, 3-1, 50.500
131. Gladstone, 473, 3-1, 40.750
132. Stockbridge, 462, 3-1, 52.500
133. Reed City, 461, 3-1, 46.500
134. Harrison, 444, 4-0, 62.000
135. Kingsley, 439, 3-1, 48.750
136. Grand Rapids West Catholic, 438, 4-0, 82.000
137. Lakeview, 426, 3-1, 42.000
138. Beaverton, 422, 3-1, 42.250
139. Jonesville, 419, 3-1, 46.500
140. Jackson Lumen Christi, 417, 4-0, 72.000
141. Monroe St. Mary Catholic Central, 417, 4-0, 78.000
142. Millington, 414, 4-0, 74.000
143. Warren Michigan Collegiate, 414, 4-0, 66.000
144. Ithaca, 405, 4-0, 66.000
145. Sanford Meridian Early College, 404, 3-1, 44.250
146. Hillsdale, 401, 3-1, 50.750
147. Hanover-Horton, 399, 4-0, 48.000
148. Boyne City, 395, 4-0, 64.000
149. Grass Lake, 395, 4-0, 48.378
150. Madison Heights Madison, 393, 4-0, 86.000
151. Montrose, 392, 4-0, 66.000
152. Tawas, 385, 3-1, 52.500
153. Niles Brandywine, 383, 3-1, 47.833
154. Manchester, 379, 3-1, 46.750
155. Watervliet, 378, 3-1, 40.500
156. Quincy, 375, 3-1, 32.500
157. Vassar, 375, 3-1, 44.750
158. St. Charles, 373, 3-1, 54.500
159. Constantine, 371, 4-0, 70.000
160. Clinton, 367, 4-0, 62.000
161. Vandercook Lake, 366, 3-1, 36.500
162. Laingsburg, 361, 3-1, 42.750
163. Flint Beecher, 350, 4-0, 72.000
164. Grand Rapids NorthPointe Christian, 347, 3-1, 46.500
165. Ravenna, 342, 4-0, 58.000
166. Carson City-Crystal, 330, 3-1, 42.500
167. Ishpeming Westwood, 318, 3-1, 38.750
168. Marlette, 316, 3-1, 44.250
169. Homer, 312, 4-0, 50.000
170. Elkton-Pigeon-Bay Port Laker, 308, 4-0, 60.000
171. Ishpeming *^, 307, 4-0, 64.000
172. Traverse City St. Francis, 305, 3-1, 48.750
173. Burton Atherton, 304, 3-1, 44.750
174. Pewamo-Westphalia, 302, 3-1, 42.750
175. Dansville, 301, 3-1, 48.500
176. Gobles, 301, 3-1, 48.750
177. Flint Hamady, 295, 4-0, 50.000
178. Union City, 294, 4-0, 48.000
179. Rochester Hills Lutheran Northwest, 289, 3-1, 42.500
180. Whittemore-Prescott, 283, 4-0, 64.000
181. Mancelona, 282, 3-1, 30.750
182. Detroit Loyola, 278, 4-0, 80.000
183. Manton, 276, 3-1, 38.250
184. Royal Oak Shrine Catholic, 273, 4-0, 58.000
185. Hudson, 271, 3-1, 40.750
186. Grosse Pointe Woods University Liggett, 270, 3-1, 46.750
187. Decatur, 262, 4-0, 66.000
188. Lincoln Alcona, 260, 3-1, 38.500
189. Iron River West Iron County, 259, 4-0, 60.000
190. New Lothrop, 259, 4-0, 66.000
191. Blanchard Montabella, 256, 3-1, 40.000
192. Norway, 244, 3-1, 37.933
193. Saginaw Michigan Lutheran Seminary, 243, 3-1, 46.750
194. Suttons Bay, 243, 3-1, 43.667
195. Indian River Inland Lakes, 242, 3-1, 30.750
196. Ottawa Lake Whiteford, 238, 3-1, 42.750
197. Johannesburg-Lewiston, 237, 4-0, 52.000
198. Harbor Beach, 232, 4-0, 64.000
199. Bessemer *, 231, 3-1, 34.500
200. Beal City, 222, 4-0, 60.000
201. Lutheran Westland, 221, 3-1, 42.500
202. Coleman, 217, 3-1, 44.250
203. Mendon, 214, 3-1, 50.500
204. St. Ignace, 211, 4-0, 48.000
205. Pittsford, 205, 3-1, 30.750
206. Bark River-Harris, 194, 3-1, 30.333
207. Munising, 194, 3-1, 35.417
208. Fowler, 189, 4-0, 58.000
209. Morenci, 184, 4-0, 62.000
210. Muskegon Catholic Central, 183, 4-0, 72.000
211. Climax-Scotts, 169, 4-0, 44.000
212. Waterford Our Lady, 169, 3-1, 56.750
213. Lake Linden-Hubbell, 163, 3-1, 42.600
214. Hillman, 139, 4-0, 50.000
215. Baldwin, 137, 3-1, 36.500
216. Bay City All Saints, 133, 3-1, 40.500
217. Felch North Dickinson *, 113, 3-1, 30.500
218. Clarkston Everest Collegiate *, 105, 3-0, 59.333
8-Player Playoff Listing
1. Deckerville, 183, 4-0, 42.000
2. Cedarville, 158, 4-0, 42.000
3. Peck, 158, 4-0, 42.000
4. Portland St. Patrick, 96, 4-0, 42.000
5. Rapid River, 108, 4-0, 40.667
6. Battle Creek St. Philip, 157, 4-0, 40.000
7. Owendale-Gagetown, 49, 4-0, 40.000
8. Bellaire, 151, 4-0, 38.667
9. Lawrence, 191, 4-0, 32.000
10. Waldron, 89, 3-1, 28.750
11. New Haven Merritt Academy, 145, 3-1, 26.750
12. Webberville, 189, 3-1, 24.500
13. Posen, 90, 2-2, 21.500
14. Eben Junction Superior Central, 126, 2-2, 19.000
15. Kingston, 191, 2-2, 17.500
16. Engadine, 85, 2-2, 17.500
17. Burr Oak, 69, 2-2, 17.250
18. Morrice, 196, 2-2, 16.750
19. Ontonagon *, 138, 1-2, 12.167
20. Kinde-North Huron, 172, 1-3, 12.000
21. Caseville, 81, 1-3, 11.250
22. Brimley, 144, 1-3, 9.750
23. Akron-Fairgrove, 99, 1-3, 9.250
24. Big Rapids Crossroads Academy, 188, 0-4, 3.000
25. St. Joseph Michigan Lutheran *, 101, 0-4, 2.500
26. Tekonsha, 146, 0-4, 2.250
27. Carsonville-Port Sanilac, 147, 0-4, 2.000
28. Ewen-Trout Creek, 135, 0-4, 2.000
29. Litchfield, 106, 0-4, 2.000
30. Flint Michigan School For The Deaf, 56, 0-4, 2.000
31. Charlton Heston Academy, 54, 0-4, 0.750
Lung Transplant Survivor Inspires, Teaches Through Football
By
Doug Donnelly
Special for MHSAA.com
September 1, 2021
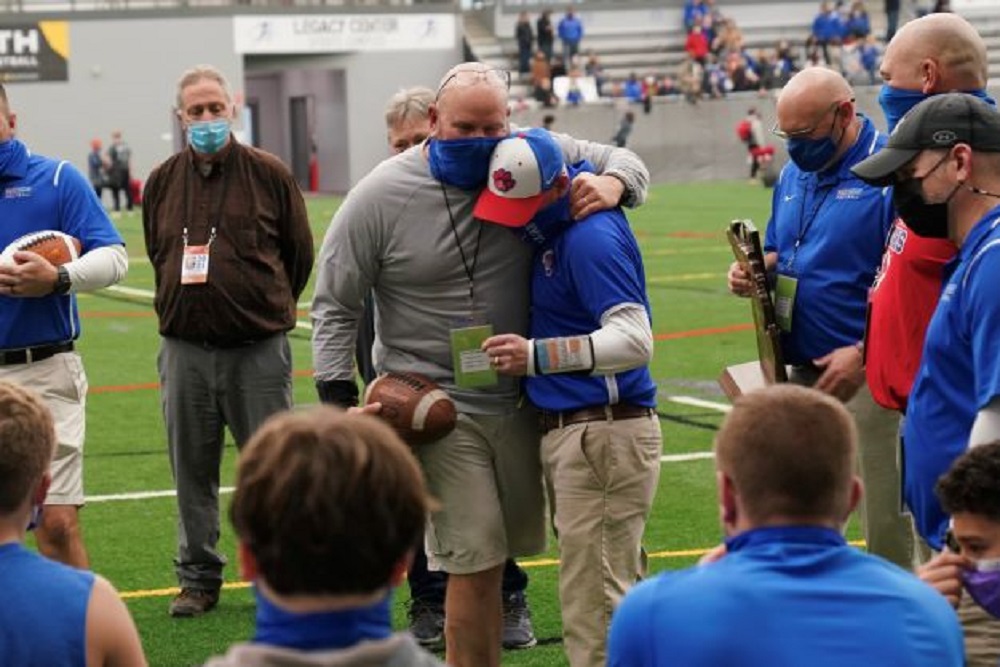
ADRIAN – As the final seconds ticked off the clock in the 2019 Division 8 Regional Football Final at Reading, Adrian Lenawee Christian assistant coach Jon Willett started looking for his wife.
 Reading would be going on to play the next week, while the LCS’s season was over. Willett desperately needed oxygen. He could barely breath.
Hillary Willett, Jon’s wife, pulled the car as close to the Reading field as she could, and Jon opened the door.
“I got in the car and sat down,” Willett said. “And I looked at her and I said, ‘I just coached my last game.’”
As miracles go, Willett was wrong. Less than two months after that football game that Willett thought was his last, he underwent a double lung transplant at the University of Michigan Hospital. He still doesn’t know how he survived so long, but is certain there was divine intervention.
“I’ve always had a close relationship with Jesus Christ,” Willett said. “And I’ve always been passionate about football. I always thought that if I survived, I would use football as a tool to reach younger people. I’m doing that today.”
Willett helped coach the Cougars to last season’s 8-Player Division 1 championship and is back on the sidelines this season, coaching the Cougars JV team and continuing to serve as an assistant with the varsity.
He even gets in on some drills now and then, such as doing push-ups with the quarterbacks.
“Jon has been with me for seven or eight years,” LCS varsity head coach Bill Wilharms said. “He’s a great man and a great football coach. The kids love having him around, and he loves them. I love coaching with him, and he’s a big part of our coaching family.”
Willett grew up in Sand Creek, about 10 minutes south of Adrian in Lenawee County. He played on some outstanding Aggies football teams for Hall of Fame coach Ernie Ayers. Willett led the 1990 Aggies in rushing, finishing just shy of 1,000 yards his senior season.
He got into coaching when his sons, Noah and Isaiah, began playing flag football.
“I coached them in flag football, then in Pop Warner,” Willett said. “I love coaching football. When Noah was in middle school I coached him one year, then became an assistant for the varsity.”
 Wilharms tabbed Willett to be the JV head coach, a position he’s held for the last couple of years. He also coaches varsity wide receivers and defensive backs and will assist the LCS scout team quarterbacks at practice. He jumps in whenever needed.
Sometimes, it’s as a motivational speaker.
“I share my testimony whenever possible,” Willett said. “I tell my players that life is short. You never know how long you are going to have. You truly don’t. You have to live your life to the fullest.”
Willett first was diagnosed with idiopathic pulmonary fibrosis – chronic, progressive lung disease – in April 2017 when he visited the doctor due to a constant cough and shortness of breath. The prognosis was not good.
“The doctor said at that point I had 65-percent capacity of my lungs,” he said. “They gave me three to five years unless I could get a double lung transplant. They said that would be the only option and that there was no cure.”
Willett believed the doctors, of course, but admits he wasn’t the best patient.
“I figured if I could make it 10 years, my kids would be out of school,” he said.
The disease had other ideas. While he was put on oxygen due to shortness of breath, his LCS football players had no idea.
“I never did it in front of them,” he said. “I should have. I wasn’t a very good patient. I was wanting to be with the team. I wanted to coach.”
In July 2019, he noticed a big change.
“My lung capacity had dropped,” he said.
He continued to coach. He had some doctors’ appointments here and there but remained coaching the entire season.
“It was a mental thing,” he said. “I wanted to get through the season.”
He rode the bus to the LCS-Reading game. When the game was over, he told Wilharms that he had to go home.
“I told Coach Wilharms that I was just getting in the car with my wife,” he said. “She pulled the car up to the gate because it was so hard to walk. I couldn’t get air because of not having oxygen.”
When he told his wife that he thought he would never coach again, she said no.
“She looked at me and she said, ‘(You’ve coached your last game) with those lungs.’”
By Christmas of 2019, Willett had been in and out of the hospital on numerous occasions. He was on oxygen tanks around the clock. He went home at Christmas, believing it was his last.
“I said I want to go home. I think it’s my last Christmas. I wanted to be with my family,” he recalled.
When he returned to the hospital after Christmas, his son Noah sat in the backseat during the car ride changing out oxygen tanks every few minutes just to keep his father alive. Willett’s oxygen levels were dangerously low.
 “When I got to U-M, there was a whole team of people waiting for me. They worked on me and sent me up to ICU. It was bleak,” he said.
The LCS community sent out word via social media to pray for Coach Willett, his wife, two sons and two daughters, Emily and Abigail. Willett said those prayers were answered.
Willett was told by doctors he had to have a double lung transplant within 24 hours, or he would die. Seven hours and 13 minutes later, the doctor walked in, with tears in his eyes, and told the family they found a match.
Willett is feeling better now. In February of this year, about a month after Willett watched from the sidelines as LCS won the championship in Brighton, the medications he had been on took hold and he began to improve.
When the season started this summer, Willett was no doubt going to be part of the Cougars staff.
“Everything is very stable right now,” he said. “My lungs keep getting better. I can tell at football practice, walking from end zone to end zone, I’m feeling better. I’m building up. That exercise helps.”
Some day he plans on reaching out to the family of the person who donated lungs to him. For now, he’s grateful to be alive and thankful for every moment he gets to spend coaching football.
“I’m feeling great and loving the opportunity I have to keep coaching and be with the kids,” Willett said. “The story I get to share with my players is truly a miracle. God took me to the point where it was 100 percent out of my control.
“If I can use football as a tool to keep talking to the youth and help them become better men, I’m going to do that. Football is what drives me.”
 Doug Donnelly has served as a sports and news reporter and city editor over 25 years, writing for the Daily Chief-Union in Upper Sandusky, Ohio from 1992-1995, the Monroe Evening News from 1995-2012 and the Adrian Daily Telegram since 2013. He's also written a book on high school basketball in Monroe County and compiles record books for various schools in southeast Michigan. E-mail him at [email protected] with story ideas for Jackson, Washtenaw, Hillsdale, Lenawee and Monroe counties.
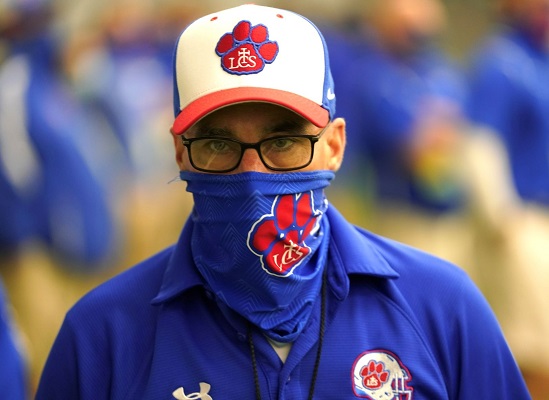
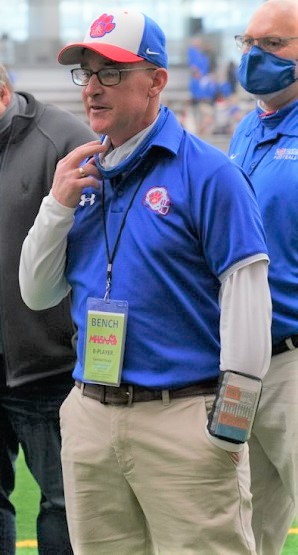
PHOTOS: (Top) Lenawee Christian head varsity coach Bill Wilharms (holding football) gives assistant Jon Willett a hug after last season’s 8-Player Division 1 Final win. (Middle) Willett returned to the sideline a year after a double lung transplant. (Below) Willett serves as junior varsity head coach and varsity assistant. (Photos by Jeff Jameson/Lenawee Christian Schools.)