

2014 Week 5 Football Playoff Listing
September 23, 2014
By Geoff Kimmerly
Second Half editor
Here is a list of Michigan High School Athletic Association football playing schools, displaying their win-loss records and playoff averages through the fourth week of the season.
Schools on this list are in enrollment order for 11-player teams, with 8-player teams ordered by playoff average. An asterisk (*) beside a record indicates a team has eight or fewer games scheduled. A caret (^) beside a school’s name indicates a team is one win away from playoff qualification.
Those schools with 11-player teams with six or more wins playing nine-game schedules, or five or more wins playing eight games or fewer, will qualify for the MHSAA Football Playoffs beginning Oct. 31. Schools with 5-4, 4-3 or 4-4 records may qualify if the number of potential qualifiers by win total does not reach the 256 mark. Schools with six or more wins playing nine-game schedules or five or more wins playing eight games or fewer may be subtracted from the field based on playoff average if the number of potential qualifiers exceeds the 256 mark.
Once the 256 qualifying schools are determined, they will be divided by enrollment groups into eight equal divisions of 32 schools, and then drawn into regions of eight teams each and districts of four teams each.
Those schools with 8-player teams will be ranked by playoff average at season’s end, and the top 16 programs will be drawn into regions of eight teams each for the playoff in that division, which also begins Oct. 31.
To review a list of all football playoff schools, individual school playoff point details and to report errors, visit the Football page of the MHSAA Website.
The announcement of the qualifiers and first-round pairings for both the 11 and 8-player playoffs will take place on Oct. 26 on the Selection Sunday Show on FOX Sports Detroit. The playoff qualifiers and pairings will be posted to the MHSAA Website following the Selection Sunday Show.
11-Player Playoff Listing
1. Macomb Dakota, 2814, 3-1, 72.750
2. Sterling Heights Stevenson, 2767, 3-1, 66.250
3. Clarkston, 2742, 4-0, 98.000
4. Grand Blanc, 2668, 3-1, 66.500
5. East Kentwood, 2592, 4-0, 90.000
6. Rockford, 2555, 4-0, 98.000
7. Dearborn Fordson, 2411, 4-0, 88.000
8. Northville, 2298, 3-1, 64.750
9. Holland West Ottawa, 2293, 3-1, 74.500
10. Canton, 2289, 3-1, 66.500
11. Detroit Cass Tech, 2277, 4-0, 86.000
12. Plymouth, 2116, 3-1, 62.750
13. Lapeer, 2112, 4-0, 82.000
14. Hartland, 2007, 3-1, 72.000
15. Monroe, 1992, 3-1, 66.750
16. Grand Haven, 1960, 3-1, 70.500
17. West Bloomfield, 1929, 3-1, 66.750
18. Westland John Glenn, 1872, 3-1, 62.750
19. Warren Mott, 1870, 3-1, 70.500
20. Oxford, 1864, 4-0, 94.000
21. Livonia Stevenson, 1848, 3-1, 58.250
22. Saline, 1844, 3-1, 68.500
23. Walled Lake Central, 1815, 3-1, 68.500
24. Hudsonville, 1759, 3-1, 64.750
25. Waterford Mott, 1738, 3-1, 66.750
26. Livonia Churchill, 1696, 4-0, 98.000
27. Flint Carman-Ainsworth, 1568, 3-1, 64.500
28. Warren DeLaSalle, 1562, 3-1, 52.750
29. Detroit Western International, 1521, 3-1, 54.500
30. Detroit Martin Luther King, 1507, 4-0, 88.000
31. Walled Lake Western, 1502, 4-0, 88.000
32. Traverse City Central, 1490, 3-1, 66.250
33. Oak Park, 1486, 3-1, 66.750
34. Brownstown Woodhaven, 1484, 4-0, 92.000
35. Southgate Anderson, 1374, 3-1, 60.750
36. Dearborn Edsel Ford, 1356, 3-1, 66.250
37. Wyandotte Roosevelt, 1351, 3-1, 72.500
38. Detroit East English, 1345, 3-1, 66.750
39. Portage Northern, 1345, 3-1, 71.833
40. Port Huron, 1336, 3-1, 72.750
41. Ypsilanti Community, 1300, 3-1, 66.250
42. Birmingham Brother Rice, 1298, 4-0, 96.000
43. Garden City, 1290, 3-1, 50.750
44. Muskegon Mona Shores, 1274, 3-1, 74.750
45. Birmingham Groves, 1270, 4-0, 84.000
46. Berkley, 1265, 4-0, 80.000
47. Flushing, 1260, 3-1, 70.250
48. Midland Dow, 1255, 4-0, 90.000
49. South Lyon, 1254, 4-0, 94.000
50. Southfield, 1239, 3-1, 68.750
51. Farmington Hills Harrison, 1212, 3-1, 68.500
52. Fenton, 1181, 4-0, 92.000
53. Farmington, 1178, 3-1, 66.500
54. Grand Rapids Northview, 1177, 3-1, 62.500
55. Warren Woods Tower, 1175, 4-0, 86.000
56. Muskegon, 1157, 4-0, 98.000
57. Lowell, 1145, 4-0, 78.000
58. Greenville, 1130, 3-1, 52.250
59. Gibraltar Carlson, 1129, 3-1, 62.500
60. Grand Rapids Forest Hills Northern, 1113, 4-0, 86.000
61. Holland, 1109, 3-1, 60.250
62. Marquette, 1090, 3-1, 58.100
63. St. Johns, 1088, 4-0, 88.000
64. Byron Center, 1085, 3-1, 62.750
65. Allen Park, 1069, 3-1, 68.750
66. Auburn Hills Avondale, 1056, 3-1, 58.500
67. Orchard Lake St. Mary's, 1054, 4-0, 88.000
68. Mt. Pleasant, 1050, 3-1, 70.750
69. St. Joseph, 1028, 3-1, 70.750
70. Petoskey, 965, 3-1, 60.750
71. Romulus, 950, 3-1, 50.500
72. Riverview, 935, 4-0, 84.000
73. DeWitt, 930, 4-0, 92.000
74. Gaylord, 927, 4-0, 74.000
75. Linden, 921, 3-1, 60.750
76. Detroit Mumford, 919, 3-1, 56.250
77. Cedar Springs, 910, 3-1, 52.250
78. Grand Rapids Christian, 895, 3-1, 62.750
79. Stevensville Lakeshore, 887, 4-0, 97.333
80. Niles, 885, 3-1, 60.500
81. Carleton Airport, 879, 3-1, 52.750
82. Coldwater, 876, 4-0, 72.000
83. New Boston Huron, 867, 3-1, 58.750
84. Warren Fitzgerald, 857, 3-1, 60.750
85. Zeeland West, 850, 4-0, 74.000
86. Dearborn Divine Child, 848, 3-1, 57.583
87. St. Clair, 844, 3-1, 60.750
88. Edwardsburg, 839, 3-1, 58.750
89. Chelsea, 838, 3-1, 70.500
90. Plainwell, 812, 3-1, 56.500
91. Detroit Denby, 800, 3-1, 68.500
92. Vicksburg, 794, 4-0, 80.000
93. Bloomfield Hills Cranbrook-Kingswood, 790, 3-1, 50.500
94. Cadillac, 747, 4-0, 88.000
95. Goodrich, 737, 3-1, 64.750
96. Dearborn Heights Robichaud, 717, 4-0, 64.667
97. Yale, 716, 3-1, 50.750
98. Muskegon Orchard View, 662, 3-1, 52.250
99. Williamston, 659, 4-0, 80.000
100. Paw Paw, 657, 3-1, 56.750
101. Lansing Sexton, 652, 4-0, 98.000
102. Whitehall, 644, 4-0, 72.000
103. Kalamazoo Hackett, 635, 4-0, 64.000
104. Richmond, 630, 4-0, 80.000
105. Wyoming Kelloggsville, 610, 3-1, 50.750
106. Wyoming Godwin Heights, 609, 4-0, 58.000
107. Saginaw Swan Valley, 602, 4-0, 64.000
108. Birch Run, 575, 4-0, 72.000
109. Remus Chippewa Hills, 567, 4-0, 80.000
110. Marine City, 553, 4-0, 74.000
111. Flint Powers Catholic, 553, 3-1, 66.500
112. Freeland, 549, 4-0, 80.000
113. Ann Arbor Gabriel Richard, 545, 3-1, 46.750
114. Stanton Central Montcalm, 539, 3-1, 54.250
115. Portland, 538, 3-1, 62.750
116. Menominee, 532, 4-0, 81.467
117. Detroit University Prep, 530, 3-1, 52.750
118. River Rouge, 530, 3-1, 62.000
119. Frankenmuth, 528, 3-1, 54.750
120. Gladwin, 528, 3-1, 48.750
121. Ida, 527, 4-0, 66.000
122. Hopkins, 522, 3-1, 52.250
123. Lansing Catholic, 515, 4-0, 78.000
124. Almont, 512, 4-0, 64.000
125. Newaygo, 506, 3-1, 52.750
126. Olivet, 505, 3-1, 48.000
127. Muskegon Oakridge, 501, 3-1, 46.750
128. Onsted, 499, 3-1, 40.750
129. Chesaning, 480, 3-1, 52.750
130. Manistee, 479, 3-1, 50.500
131. Gladstone, 473, 3-1, 40.750
132. Stockbridge, 462, 3-1, 52.500
133. Reed City, 461, 3-1, 46.500
134. Harrison, 444, 4-0, 62.000
135. Kingsley, 439, 3-1, 48.750
136. Grand Rapids West Catholic, 438, 4-0, 82.000
137. Lakeview, 426, 3-1, 42.000
138. Beaverton, 422, 3-1, 42.250
139. Jonesville, 419, 3-1, 46.500
140. Jackson Lumen Christi, 417, 4-0, 72.000
141. Monroe St. Mary Catholic Central, 417, 4-0, 78.000
142. Millington, 414, 4-0, 74.000
143. Warren Michigan Collegiate, 414, 4-0, 66.000
144. Ithaca, 405, 4-0, 66.000
145. Sanford Meridian Early College, 404, 3-1, 44.250
146. Hillsdale, 401, 3-1, 50.750
147. Hanover-Horton, 399, 4-0, 48.000
148. Boyne City, 395, 4-0, 64.000
149. Grass Lake, 395, 4-0, 48.378
150. Madison Heights Madison, 393, 4-0, 86.000
151. Montrose, 392, 4-0, 66.000
152. Tawas, 385, 3-1, 52.500
153. Niles Brandywine, 383, 3-1, 47.833
154. Manchester, 379, 3-1, 46.750
155. Watervliet, 378, 3-1, 40.500
156. Quincy, 375, 3-1, 32.500
157. Vassar, 375, 3-1, 44.750
158. St. Charles, 373, 3-1, 54.500
159. Constantine, 371, 4-0, 70.000
160. Clinton, 367, 4-0, 62.000
161. Vandercook Lake, 366, 3-1, 36.500
162. Laingsburg, 361, 3-1, 42.750
163. Flint Beecher, 350, 4-0, 72.000
164. Grand Rapids NorthPointe Christian, 347, 3-1, 46.500
165. Ravenna, 342, 4-0, 58.000
166. Carson City-Crystal, 330, 3-1, 42.500
167. Ishpeming Westwood, 318, 3-1, 38.750
168. Marlette, 316, 3-1, 44.250
169. Homer, 312, 4-0, 50.000
170. Elkton-Pigeon-Bay Port Laker, 308, 4-0, 60.000
171. Ishpeming *^, 307, 4-0, 64.000
172. Traverse City St. Francis, 305, 3-1, 48.750
173. Burton Atherton, 304, 3-1, 44.750
174. Pewamo-Westphalia, 302, 3-1, 42.750
175. Dansville, 301, 3-1, 48.500
176. Gobles, 301, 3-1, 48.750
177. Flint Hamady, 295, 4-0, 50.000
178. Union City, 294, 4-0, 48.000
179. Rochester Hills Lutheran Northwest, 289, 3-1, 42.500
180. Whittemore-Prescott, 283, 4-0, 64.000
181. Mancelona, 282, 3-1, 30.750
182. Detroit Loyola, 278, 4-0, 80.000
183. Manton, 276, 3-1, 38.250
184. Royal Oak Shrine Catholic, 273, 4-0, 58.000
185. Hudson, 271, 3-1, 40.750
186. Grosse Pointe Woods University Liggett, 270, 3-1, 46.750
187. Decatur, 262, 4-0, 66.000
188. Lincoln Alcona, 260, 3-1, 38.500
189. Iron River West Iron County, 259, 4-0, 60.000
190. New Lothrop, 259, 4-0, 66.000
191. Blanchard Montabella, 256, 3-1, 40.000
192. Norway, 244, 3-1, 37.933
193. Saginaw Michigan Lutheran Seminary, 243, 3-1, 46.750
194. Suttons Bay, 243, 3-1, 43.667
195. Indian River Inland Lakes, 242, 3-1, 30.750
196. Ottawa Lake Whiteford, 238, 3-1, 42.750
197. Johannesburg-Lewiston, 237, 4-0, 52.000
198. Harbor Beach, 232, 4-0, 64.000
199. Bessemer *, 231, 3-1, 34.500
200. Beal City, 222, 4-0, 60.000
201. Lutheran Westland, 221, 3-1, 42.500
202. Coleman, 217, 3-1, 44.250
203. Mendon, 214, 3-1, 50.500
204. St. Ignace, 211, 4-0, 48.000
205. Pittsford, 205, 3-1, 30.750
206. Bark River-Harris, 194, 3-1, 30.333
207. Munising, 194, 3-1, 35.417
208. Fowler, 189, 4-0, 58.000
209. Morenci, 184, 4-0, 62.000
210. Muskegon Catholic Central, 183, 4-0, 72.000
211. Climax-Scotts, 169, 4-0, 44.000
212. Waterford Our Lady, 169, 3-1, 56.750
213. Lake Linden-Hubbell, 163, 3-1, 42.600
214. Hillman, 139, 4-0, 50.000
215. Baldwin, 137, 3-1, 36.500
216. Bay City All Saints, 133, 3-1, 40.500
217. Felch North Dickinson *, 113, 3-1, 30.500
218. Clarkston Everest Collegiate *, 105, 3-0, 59.333
8-Player Playoff Listing
1. Deckerville, 183, 4-0, 42.000
2. Cedarville, 158, 4-0, 42.000
3. Peck, 158, 4-0, 42.000
4. Portland St. Patrick, 96, 4-0, 42.000
5. Rapid River, 108, 4-0, 40.667
6. Battle Creek St. Philip, 157, 4-0, 40.000
7. Owendale-Gagetown, 49, 4-0, 40.000
8. Bellaire, 151, 4-0, 38.667
9. Lawrence, 191, 4-0, 32.000
10. Waldron, 89, 3-1, 28.750
11. New Haven Merritt Academy, 145, 3-1, 26.750
12. Webberville, 189, 3-1, 24.500
13. Posen, 90, 2-2, 21.500
14. Eben Junction Superior Central, 126, 2-2, 19.000
15. Kingston, 191, 2-2, 17.500
16. Engadine, 85, 2-2, 17.500
17. Burr Oak, 69, 2-2, 17.250
18. Morrice, 196, 2-2, 16.750
19. Ontonagon *, 138, 1-2, 12.167
20. Kinde-North Huron, 172, 1-3, 12.000
21. Caseville, 81, 1-3, 11.250
22. Brimley, 144, 1-3, 9.750
23. Akron-Fairgrove, 99, 1-3, 9.250
24. Big Rapids Crossroads Academy, 188, 0-4, 3.000
25. St. Joseph Michigan Lutheran *, 101, 0-4, 2.500
26. Tekonsha, 146, 0-4, 2.250
27. Carsonville-Port Sanilac, 147, 0-4, 2.000
28. Ewen-Trout Creek, 135, 0-4, 2.000
29. Litchfield, 106, 0-4, 2.000
30. Flint Michigan School For The Deaf, 56, 0-4, 2.000
31. Charlton Heston Academy, 54, 0-4, 0.750
Drive for Detroit: Playoff Week 3 Review
November 12, 2018
By Geoff Kimmerly
Second Half editor
The results are fewer at this stage of the MHSAA Football Playoffs, but the headlines are louder with more on the line and the best of the best running into each other with only a few weeks left to play.
 This third round saw our 8-Player Finals pairings set – with those championship games taking place this Saturday at Northern Michigan University’s Superior Dome. Morrice will face Pickford in Division 1, while Rapid River will take on Onekama in Division 2.
Meanwhile, in 11-Player Regional Finals, we saw history made for Belleville, Holton and Breckenridge to name a few. We also saw the end to Pewamo-Westphalia’s attempt at making a fourth a straight MHSAA championship game, and said good-bye to one of Michigan’s most prominent high school programs and the winningest coach in state history.
Click to check out the scores through the first three weeks of the tournament and the pairings for the weekend ahead. “Drive for Detroit” is powered by MI Student Aid.
Division 1
HEADLINER: Saline 13, Rockford 12 (OT) The Hornets’ impressive body of work this season grows by the week. By outlasting Rockford with a 2-point conversion stand, they advanced to the Semifinals for the first time since finishing Division 1 runner-up in 2014. Add to this one to wins over East Kentwood two weeks ago and Grand Rapids Catholic Central in Week 2 – and giving unbeaten Clinton Township Chippewa Valley its closest game of the season in a five-point Week 1 loss – and it continues to be quite a run. Rockford also should be proud; after opening 1-3 this fall, the Rams not only extended a record 24-year playoff streak but won their first District title since 2015. Click for more from the Ann Arbor News and see below for highlights from FOX 17.
Rockford falls to Saline in overtime https://t.co/hqXVzXeNxh
— FOX 17 Blitz (@FOX17Blitz) November 11, 2018
Regional Recap: Clarkston 13, Lapeer 0 The reigning Division 1 champion Wolves (10-2) locked down their fourth Regional title in six seasons and eliminated Lapeer (11-1) for the third time over the last five – and second time during that string where the Lightning entered the game undefeated. Belleville 13 West Bloomfield 10 The Tigers (12-0) have broken through with their first Regional title, defeating last season’s Division 1 runner-up West Bloomfield (9-3) to make their first Semifinal. Clinton Township Chippewa Valley 42, Dearborn Fordson 7 The Big Reds (12-0) are headed to the Semifinals for the first time since 2003 after shutting down a Tractors team that finished 10-2 and was averaging 38 points per game.
Division 2
HEADLINER: Birmingham Groves 53, Livonia Franklin 29 The Falcons (10-2) are headed to their second Semifinals in three seasons after downing Franklin (7-5), a semifinalist a year ago. Groves has run off 10 straight victories since opening this fall 0-2, and the 53 points were a season high. Franklin led at the end of the first quarter 2-0 before the Falcons ran off 21 unanswered points during the second. Click for more from the Oakland Press and see highlights below from State Champs Sports Network.
??VIDEO: Check out the highlights of the Birmingham Groves (@GrovesAthletics) vs. Livonia Franklin (@fhspatriots) - Division 2 @MHSAA Regional from last night pic.twitter.com/it2SgcfOdH
— STATE CHAMPS! (@statechampsnet) November 10, 2018
Regional Recap: Muskegon Mona Shores 58, Portage Northern 28 The Sailors (11-1) also scored a season high to win their second Regional title ever and first since 2014, over a Northern team that at 9-3 tied its program record for wins set in 1981. Midland 43, Walled Lake Western 0 The Chemics (9-3) won their first Regional title since 2007 with one of the most impressive victories of the weekend, handing Western (8-4) its first shutout since the 2016 Division 2 Final. Warren DeLaSalle 21, Port Huron Northern 3 The reigning Division 2 champion Pilots (10-2) ended the winningest season since 1986 for Northern (10-2), which did hold DeLaSalle to its third-fewest points of this fall.
Division 3
HEADLINER: Muskegon 34, Cedar Springs 18 The reigning Division 3 champion Big Reds (12-0) withstood one of their toughest challenges of this season, as Cedar Springs (10-2) trailed by only a point, 13-12, at halftime. Muskegon quarterback Cameron Martinez – who broke La’Darius Jefferson’s school season record of 2,095 rushing yards during the game – ran for 32 and 75-yard scores during the third quarter. The Red Hawks finished with their most wins since going 11-2 in 2000. Click for more from the Muskegon Chronicle and see highlights below from WZZM.
Muskegon runs past Cedar Springs, 34-18 https://t.co/3zLDlXpvwW pic.twitter.com/0BMZVhygq2
— 13 On Your Side (@wzzm13) November 10, 2018
Regional Recap: Zeeland East 50, Parma Western 24 The Chix are headed to the Semifinals for the first time since 1989 when East and West were one school. Parma Western ended its longest playoff run with a school record for wins at 10-2. DeWitt 42, Farmington 7 The Panthers (12-0) bounced back offensively after scoring nine points in the District Final and as a defense giving up eight points per game locked down the Falcons (8-4), who completed their longest run since 2002. Detroit Martin Luther King 54, Allen Park 15 The Crusaders (10-2) won their sixth Regional title in eight seasons, ending Allen Park’s at 9-3 after the Jaguars bounced back from just missing the playoffs in 2017.
Division 4
HEADLINER: Chelsea 21, Farmington Hills Harrison 14 The Bulldogs (9-3) have risen from third in their league during the regular season to win their second Regional title over the last four years, this time under first-year coach Josh Lucas. Chelsea’s win also marked the end of Farmington Hills Harrison football under coach John Herrington, who concluded as the winningest coach in MHSAA history with a 443-112-1 record since starting the program in 1970. Harrison (8-4) is closing next summer. Click for more from the Sun Times News.
??VIDEO: Check out the highlights of the Chelsea (@ChelseaBulldogs) vs. Farmington Hills Harrison - @MHSAA Division 4 Regional Final from this afternoon pic.twitter.com/ps3DE3V51Z
— STATE CHAMPS! (@statechampsnet) November 10, 2018
Regional Recap: Grand Rapids Catholic Central 35, Escanaba 6 For the third straight season, the two-time reigning Division 4 champion Cougars (11-1) eliminated the Eskymos (9-3), this time holding Escanaba to its fewest points of the fall. Edwardsburg 56, Holland Christian 21 The Eddies (12-0) set up a rematch of last season’s Division 4 Final (a 42-31 loss to GRCC) by scoring more than 50 points for the seventh time this season, ending a nice run for Holland Christian (8-4) with its best record since 2009. Williamston 28, St. Clair 0 The Hornets (10-2) advanced to their first Semifinal since 2010 by shutting out a St. Clair team that finished 9-3 and had scored a combined 132 points over its first two playoff games.
Division 5
HEADLINER: Saginaw Swan Valley 36, Reed City 28 Swan Valley’s side of this bracket began with four of the 30 undefeated teams left in all of 11-player at the end of the regular season, and the Vikings (12-0) remained one by edging another over the weekend. Reed City (11-1) gave Swan Valley its closest game this season and a closer one than when the two met and the Vikings won 29-14 in a Semifinal a year ago. How close was it? Reed City ended the game on Swan Valley’s 2-yard line. Click for more from the Saginaw News and see highlights below from WJRT.
.@SwanValleyFball fights back to beat Reed City, repeat as regional champion @swanvalleysporthttps://t.co/AG4qBQjVkp
— ABC12WJRT (@ABC12WJRT) November 11, 2018
Regional Recap: Hudsonville Unity Christian 39, Kalamazoo United 14 The Crusaders (10-2) advanced to their second Semifinal in three seasons by locking down a Titans offense averaging 53 points per game heading into Saturday. United finished 11-1, its best since the co-op between Hackett and Kalamazoo Christian was formed in 2014. Portland 40, Frankenmuth 6 The Raiders are headed to their first Semifinal since winning Division 5 in 2012 after stopping Frankenmuth (9-3) in its quest to win a third straight Regional title. Marine City 40, Detroit Denby 32 (2OT) The Mariners also finished third in their league during the regular season, but are headed to the Semifinals for the first time since winning Division 4 in 2013. Denby (9-3) concluded its winningest season and longest playoff run both since 2006, with its losses this fall by a combined 18 points.
Division 6
HEADLINER: Montrose 37, Flint Hamady 6 As noted above, this weekend was good to teams finishing third in their leagues this fall. The Rams (10-2) did so in the Mid-Michigan Activities Conference, but with this victory won their first Regional title since 2013 and ended the longest run and winningest season ever for Hamady (11-1). Click for more from the Flint Journal and see highlights below from WEYI.
.@MontroseRams with a dominant second half, they're moving on to the semifinals https://t.co/aAsB0C0vrt
— Jonathan Deutsch (@JonathanD_TV) November 11, 2018
Regional Recap: Montague 30, Schoolcraft 14 The Wildcats (10-2) reached double-digit wins for the third time in four seasons with their first Regional title since 2009 – when it went on to win the Division 6 title. Schoolcraft (9-3) finished by playing in its first Regional Final since 2013. Traverse City St. Francis 41, Kingsley 20 The Gladiators (12-0) won their third Regional title in four seasons, although Kingsley (10-2) cut the deficit after St. Francis won their first meeting by 35 in Week 4. Jackson Lumen Christi 33, Blissfield 0 Two-time reigning Division 6 champion Lumen Christi (11-0) won its third straight Regional title with its third shutout of the season. Blissfield (7-5) was held scoreless for the first time since 2016.
Division 7
HEADLINER: New Lothrop 26, Pewamo-Westphalia 14 It’s rare that the loudest headline from a football weekend comes from one of the divisions pitting the state’s smaller schools. But it certainly was noticed when New Lothrop (11-1) ended the two-time reigning champ Pirates’ 24-game winning streak. P-W (11-1) had beaten New Lothrop 35-14 in a District Final only a year ago, but now the Hornets will return to the Semifinals for the first time since 2015. Click for more from the Flint Journal.
??VIDEO: Check out the highlights of the Pewamo-Westphalia vs. New Lothrop (@NLAPS) - @MHSAA Division 7 Football Regional Final from last night. pic.twitter.com/R2KxGEr4XN
— STATE CHAMPS! (@statechampsnet) November 10, 2018
Regional Recap: Lake City 34, Roscommon 28 The Trojans (12-0) held off Roscommon (10-2) to make the Semifinals for the second straight season and extend their run of the last two years to a combined 24-1. Cassopolis 23, Monroe St. Mary Catholic Central 22 The Rangers’ defense, giving up now 4.3 points per game, was tested for the first time. But Cassopolis (12-0) won its second Regional title in three years by stopping St. Mary (9-3) on a goal line stand to finish the game. Madison Heights Madison 44, Riverview Gabriel Richard 7 The Eagles (12-0) are returning to the Semifinals after handing a playoff defeat to Gabriel Richard (7-5) for the second straight season.
Division 8
HEADLINER: Holton 14, Mendon 6 The Red Devils’ first playoff season since 2007 now includes its first Regional title ever. Holton (8-4) outlasted annual power Mendon to move on after both reached the playoffs as additional qualifiers at 5-4 to end the regular season. The Hornets, after winning their 10th District title in 12 seasons, finished 7-5. Click for more from the Muskegon Chronicle.
Holton’s dream season continues with regional final win over Mendonhttps://t.co/rOsnwjpYie
— FOX 17 Blitz (@FOX17Blitz) November 11, 2018
Regional Recap: Breckenridge 12, Ishpeming 6 The Huskies (12-0) have taken the steps from first playoff berth in 2016 since 1993, to first District title ever last season to now first Regional championship. Breckenridge drove north and handed Ishpeming (11-1) its only defeat by locking down an offense averaging 42 points per game entering the weekend. Harbor Beach 35, Flint Beecher 0 The Pirates (11-1) are back in the Semifinals for the first time since making three straight trips from 2012-14. Beecher (8-4) closed its longest playoff run since 2012 in Division 7. Reading 54, Detroit Southeastern 0 The Rangers (12-0) now have shutouts in half of their games this season and their first Regional title since 2008. It was a memorable fall for Southeastern (8-4), which made the playoffs for the first time since 2010 and only two years removed from a 3-24 three-year string.
8-Player Division 1
SEMIFINAL: Pickford 40, AuGres-Sims 20 The Wolverines (11-1) were giving up only 7.5 points per game and hadn’t scored fewer than 50 this season. But Pickford (12-0) dominated on both sides of the ball, breaking through for its first MHSAA championship game berth after missing in Semifinals the last two seasons. Click for more from the Sault Ste. Marie Evening News and see highlights below from MI Sports Now.
#Pickford is heading to the #SuperiorDome with a victory over #AuGresSims - https://t.co/GjMaqbuTQN pic.twitter.com/3Ef8cKnCzA
— MISportsNow (@MISportsNow) November 11, 2018
SEMIFINAL: Morrice 40, Colon 8 The Orioles (12-0) will continue their deepest playoff run ever, with this victory securing their first MHSAA Finals berth. Morrice locked down a Colon offense averaging 44 points per game, and the Magi (10-2) gave up a season high. Still, it was a strong 8-player debut for Colon, which went 2-7 in 11-player a year ago and was playing in its first Semifinal in either format. Click for more from the Lansing State Journal.
8-Player Division 2
SEMIFINAL: Onekama 28, Portland St. Patrick 14 The Portagers will play in their first MHSAA football championship game after doubling up last season’s Division 2 runner-up. Onekama (10-2) also set a program record for wins, piling up 20 straight points to hold off the Shamrocks (7-5). Click for more from the Traverse City Record-Eagle.
#Onekama is heading to the #SuperiorDome! The #Portagers punched their ticket today with a victory over #PortlandStPatrick - https://t.co/NsV2IwDomD pic.twitter.com/w8Twid3VHY
— MISportsNow (@MISportsNow) November 10, 2018
SEMIFINAL: Rapid River 36, Cedarville 30 One more third-place success story from the weekend. Rapid River (9-3) downed Cedarville 28-20 in Week 7 to eventually lock up that spot in the Great Lakes Conference East, and edged the Trojans (7-5) a second time to reach the 8-Player Finals for the third time this decade and first since 2013. Click for more from the Escanaba Daily Press.
??VIDEO: Check out the highlights of the Cedarville vs. Rapid River @MHSAA 8-Player Division 2 Football Semifinal from last night. pic.twitter.com/IfZW93F1MK
— STATE CHAMPS! (@statechampsnet) November 10, 2018
Second Half’s weekly “Drive for Detroit” previews and reviews are powered by MI Student Aid, a part of the Student Financial Services Bureau located within the Michigan Department of Treasury. MI Student Aid encourages students to pursue postsecondary education by providing access to student financial resources and information, including various student financial assistance programs to help make college more affordable for Michigan students. MI Student Aid administers the state’s 529 savings programs (MET/MESP) and eight additional aid programs within its Student Scholarships and Grants division. Click for more information and connect with MI Student Aid on Facebook and Twitter @mistudentaid.
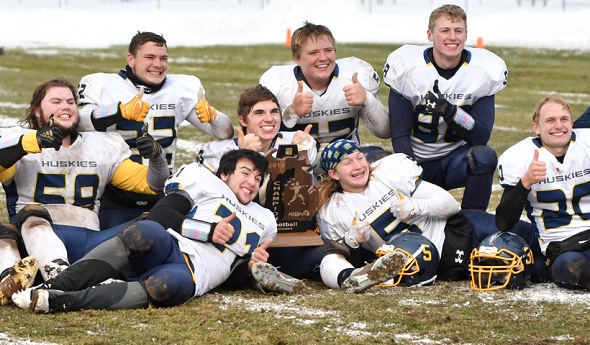
PHOTO: Breckenridge seniors give a thumbs up while celebrating their Division 8 Regional championship in Ishpeming. (Photo by Cara Kamps.)