
2014-15 Classifications Announced
March 24, 2014
By Geoff Kimmerly
Second Half editor
Classifications for Michigan High School Athletic Association elections and postseason tournaments in traditionally classified sports (A, B, C, D) for the 2014-15 school year have been announced, with enrollment breaks for postseason tournaments set up by divisions posted on the MHSAA Website.
Classifications for the upcoming school year are based on a second semester count date, which for MHSAA purposes was Feb. 12. The enrollment figure submitted for athletic classification purposes may be different from the count submitted for school aid purposes, as it does not include students ineligible for athletic competition because they reached their 19th birthday prior to September 1 of the current school year and will not include alternative education students if none are allowed athletic eligibility by the local school district.
After all the counts are submitted, tournament-qualified member schools are ranked according to enrollment, and then split as closely into quarters as possible. For 2014-15, there are 749 tournament-qualified member schools with 187 schools in Class A, B and C and 188 schools in Class D.
Effective with the 2014-15 school year, schools with 882 or more students are in Class A in MHSAA postseason tournament competition. The enrollment limits for Class B are 424-881; Class C is 215-423; and schools with enrollments of 214 and fewer are Class D. The break between Classes A and B decreased 11 students from 2013-14, the break between Classes B and C decreased five students, and the break between Classes C and D is nine students fewer than the current school year.
The new classification breaks will see 21 schools move up in class for 2014-15, while 26 schools will move down.
Schools were recently notified of their classification. MHSAA Executive Director John E. "Jack" Roberts said schools may not subsequently lower their enrollment figure. However, if revised enrollment figures should be higher and indicate that a school should be playing in a higher class, that school would be moved up.
Schools have the option to play at any higher classification for a minimum of two years, but must exercise the option by April 15 for fall sports, August 15 for winter sports and October 15 for spring sports.
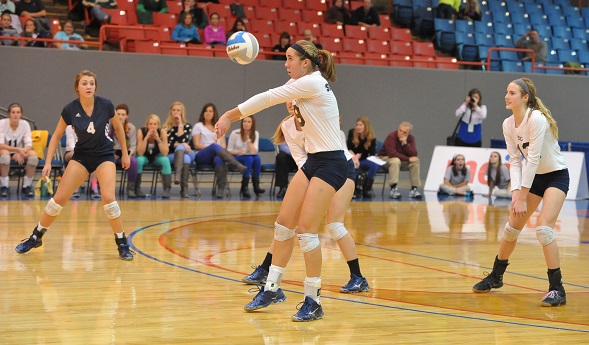
MHSAA tournament sports that will be conducted in traditional classifications for 2014-15 are Basketball and Girls Volleyball. Football will use traditional classifications to determine playoff points.
Sports which will compete in nearly equal divisions are: Baseball, Bowling, Girls Competitive Cheer, Lower Peninsula Cross Country, Lower Peninsula Golf, Ice Hockey, Lacrosse, Lower Peninsula Soccer, Skiing, Softball, Lower Peninsula Swimming and Diving, Lower Peninsula Tennis, Lower Peninsula Track and Field and Wrestling.
Visit the respective sport pages on the MHSAA Website to review the divisional alignments.
The divisions and qualifiers for the MHSAA Football Playoffs will be announced on Selection Sunday, Oct. 26, 2014.
A complete list of school enrollments used to determine classifications for the 2014-15 school year can be found on the Enrollment & Classification page of the MHSAA Website.
Here is a complete list of schools changing classification for 2014-15. (Note: This list does not include schools opting up in class/division for tournaments, which can be found on the Administrators page of the MHSAA Website under Enrollment and Classification):
Moving Up From Class B to Class A
Fruitport
Hazel Park
Romulus
Stevensville Lakeshore
Moving Down From Class A to Class B
Detroit Denby Tech & Prep
Detroit Osborn
Haslett
South Lyon East
Warren Regina
Moving Up From Class C to Class B
Detroit Benjamin Carson HS for Science & Medicine
Detroit Consortium College Prep
Detroit Henry Ford Academy School for Creative Studies
Hamtramck Frontier International Academy
Harper Woods
Hemlock
Kalkaska
Lakeview
Southfield Bradford
Wyoming Lee
Moving Down From Class B to Class C
Capac
Detroit Plymouth Educational Center
Ferndale University
Grand Rapids Wellspring Prep
Jackson Lumen Christi
Mason County Central
Millington
Monroe St. Mary Catholic Central
Napoleon
Roscommon
Ypsilanti Arbor Prep
Moving Up From Class D to Class C
Detroit University YES Academy
Eau Claire
Lutheran Westland
Marcellus
Rogers City
Taylor Preparatory
Traverse City Grand Traverse Academy
Moving Down From Class C to Class D
Detroit Universal Academy
Detroit Winans Academy of Performing Arts
Flint International Academy
Kimball Landmark Academy
Mendon
Mio-Au Sable
Newberry
Pittsford
St. Ignace LaSalle
Three Oaks River Valley
New Postseason Eligible Tournament Schools in 2014-15
Inkster Peterson Warren Academy
Lapeer
*Detroit Public Safety Academy will become tournament eligible in 2015-16.
Enrollment Breaks by Classes – 2014-15
(Number of schools in parentheses)
Class A: 882 and above (187 schools)
Class B: 424 – 881 (187)
Class C: 215 – 423 (187)
Class D: 214 and below (188)

MHSAA Attendance Posts 6-Year High
September 21, 2017
By Geoff Kimmerly
Second Half editor
MHSAA tournament events posted an increase in attendance for the second straight school year in 2016-17, drawing 1,492,469 fans – with eight boys sports enjoying larger audiences that the previous year.
Total attendance rose sixth-tenths (0.6) of a percent from 2015-16 to its highest total since 2010-11. Boys attendance rose to 1,034,625 (or 1.2 percent) to its highest total since 2011-12. Girls attendance was 457,844, continuing a trend that has seen the last three school years post the largest audiences for girls tournament events since the MHSAA began annually tracking data in 1990-91. Attendance is kept for all sports except golf, skiing and tennis, for which admission typically is not charged.
The second straight boys increase was keyed in part by a pair of records. Baseball drew 50,820 fans, breaking the previous record set during the 2009 season while also seeing a record turnout at the District level. Boys lacrosse, with 11,211 total attendance, broke the previous record set in 2010.
The boys basketball tournament, with 330,588 fans, enjoyed its highest turnout since 2010-11. Football attendance rose for the second straight year with 395,894 fans total, enjoying single-round increases at the Pre-District, District and Regional levels. Ice hockey, with 51,812 fans, also saw an increase from 2015-16, as did the boys swimming & diving tournament with 5,694 fans – its highest overall attendance since 2010-11.
Three more records contributed to the overall increase in 2016-17. Softball drew 47,364 fans total, breaking the previous record set in 1994-95. The bowling and cross country tournaments, which both include girls and boys competing at the same sites, both set records as well – bowling with 14,012 fans overall to set a record for the second straight year, and cross country with 20,671 fans, its most since 2011-12.
Two more girls sports also enjoyed increased attendance from 2015-16. The girls lacrosse tournament drew 5,691 fans, a 29 percent increase from the year before and with a record at the Regional level. Girls soccer drew 28,203 fans with increases at the District, Regional and Semifinal levels; the overall attendance was a 3.9 percent increase and the highest since the record 2006-07 season.
Also of note:
• Although girls basketball overall attendance was down half a percent to 168,674, both the Quarterfinals and Semifinal-Finals rounds saw increases from the previous season. The Semifinal-Finals weekend drew 24,120 fans, the most since the record was set for those rounds combined during the 1996 fall season (girls basketball moved from fall to winter beginning with the 2007-08 season.
• The boys basketball attendance increase was bolstered in part by the highest Semifinal-Finals weekend attendance (53,990) since 2008-09 and an increase that weekend of 14 percent from 2015-16.
• Boys Soccer Districts were watched by 15,048 fans, the most since 2008-09, and individual wrestling also enjoyed a bounce-back at its earliest rounds with a three-year high at the District level (10,792 fans) and a six-year high (8,488) at the Regional level.
• Girls gymnastics Regionals (1,146) drew their largest audience since 2002-03, while competitive cheer Regionals (7,333) enjoyed a nine-year high.
The MHSAA is a private, not-for-profit corporation of voluntary membership by more than 1,500 public and private senior high schools and junior high/middle schools which exists to develop common rules for athletic eligibility and competition. No government funds or tax dollars support the MHSAA, which was the first such association nationally to not accept membership dues or tournament entry fees from schools. Member schools which enforce these rules are permitted to participate in MHSAA tournaments, which attract more than 1.4 million spectators each year.