
2017-18 Report Shows Fewer Concussions
August 8, 2018
By Geoff Kimmerly
Second Half editor
Concussions are down, according to data compiled by the Michigan High School Athletic Association during its third year of collecting head injury reports from member high schools.
The work is not done – but this year’s data reinforces trends that emerged during the first two years of reporting and will assist the MHSAA as it explores solutions to continue reducing the incidence of head injuries in school sports.
The 2017-18 concussion report found a 9.6-percent decrease in the number of confirmed concussions from the previous year. Student-athletes at MHSAA member high schools encountered during 2017-18 a total of 3,580 head injuries – or 4.8 per member school, compared to the 2016-17 average of 5.2. Total participation in MHSAA sports for 2017-18 was 284,920 – with students counted once for each sport he or she played – and only 1.3 percent of participants experienced a head injury, down from 1.4 in 2016-17 and 1.6 percent the first year of the study.
As first mandated in 2015-16, member schools are required to report head injuries to the MHSAA identifying the sport that each student-athlete was participating in and whether the injury was sustained during practice or competition. Schools also are required to designate at which level – varsity, junior varsity or freshman – the injury occurred.
The full report of all head injuries experienced during 2017-18 by student-athletes at MHSAA member high schools – including percentages by sport (per 1,000 participants), gender and team level, as well as data tracking when athletes returned to play – is available by clicking here.
Consistent with the first two years of the study, the MHSAA received data from more than 99 percent of its member high schools after the fall, winter and spring seasons and continued to track each injury report through its conclusion this summer. Member junior high and middle schools also were allowed, although not mandated, to report their potential head injuries; and those findings are not part of the published report.
The decrease in overall head injury reports collected for 2017-18 follows a similar reduction from 2015-16 to 2016-17 – and brings the total decrease to 19.6 percent fewer reports since the first year of the study.
MHSAA Executive Director John E. “Jack” Roberts noted that the decreases in reports, both year to year and since the first year of the survey, likely have some relation to year-to-year fluctuation, refinement of the follow-up reporting process and a better understanding by schools of what is not to be included for the survey – including head injuries not diagnosed as concussions and head injuries that did not take place during MHSAA-sponsored activities.
However, the findings of this year’s study – and their similarities to the findings from the first two surveys – has begun to clarify the identification and understanding of trends. Continuing to emerge perhaps most prominently is the higher incidence of concussion reports from girls sports – and pertinent questions about physiological and social causes behind those results.
“With three years of reporting by virtually 100 percent of our high schools, what we’re learning is no longer anecdotal; the results are beginning to identify valid trends and genuine issues that need to be addressed,” Roberts said. “For example, it’s even clearer than before that girls are reporting three times the number of concussions as boys when comparing similar sports – soccer, basketball and baseball versus softball. As a result, we’ve already begun to incorporate these gender differences into our coaches education, and the writers of high school playing rules are obligated to focus on these gender differences as well.”
Although the total number of confirmed concussions was significantly lower again in 2017-18, a number of findings detailing those injuries fell in line with results of the first two surveys.
Boys experienced 2,373– or 66 percent – of those injuries, the same ratio as 2016-17, and not surprisingly as boys have a much higher participation in contact sports. More than half of head injuries – 56 percent – were experienced by varsity athletes, which for the second year also fell within a percent difference of the previous year’s findings.
A total of 2,330 head injuries – or 65 percent – came in competition as opposed to practice. More than half took place during either the middle of practice or middle of competition as opposed to the start or end, and 52 percent of injuries were a result of person-to-person contact. The MHSAA also asked schools to report the number of days between the head injury and the athlete’s return to activity – and the two largest groups, both at 24 percent, returned to activity after either 6 to 10 days of rest or 11 to 15. All of these findings were within 1-3 percent of those discovered from the 2016-17 data.
Contact sports again revealed the most head injuries. Ranking first was football, 11 and 8-player combined, with 41 head injuries per 1,000 participants – a decrease for the second straight year, this time from 44 head injuries per 1,000 participants in 2016-17 and down from 49 head injuries per 1,000 football participants shown by the first study in 2015-16.
Ice hockey repeated with the second-most injuries per 1,000, with 32 (down from 36 injuries per 1,000 from 2016-17 and 38 per 1,000 in 2015-16), and girls soccer and wrestling tied for third with 25 head injuries per 1,000 participants – girls soccer down from 28 head injuries per 1,000 participants and wrestling down from 26 per 1,000 in 2016-17.
Also consistent with 2016-17, the next five sports (after football and hockey) to show the highest incidences of head injuries were girls sports – girls soccer followed by girls basketball (22 per 1,000), girls competitive cheer (20) and girls lacrosse (20). Boys lacrosse (17), girls gymnastics (16) and boys soccer (12) were the only other sports to show double-digit head injuries per 1,000 participants.
Females again reported significantly more concussions than males playing the same or similar sports – soccer, basketball and baseball/softball. Female soccer players reported more than double the concussions per 1,000 participants as male soccer players (25 to 12), while female basketball players also reported more than double the number of concussions per 1,000 participants (22 to 9). Softball players reported seven concussions per 1,000 participants, and baseball players reported three per 1,000. Although the percentage differences vary from year to year, the results of all three comparisons remained consistent with what the survey found in 2015-16 and 2016-17.
The MHSAA in 2018-19 is directing its sport committees to focus on a pair of questions – how to increase participation and how to make their specific sports safer – the latter aiming to put some of what has been learned from concussion reporting into practice. The MHSAA also is continuing to invite Michigan’s universities, health care systems and the National Federation of State High School Associations (NFHS) to take part in analyzing the data and resulting questions that have arisen during the past three years.
“Regrettably, I do not see a nationwide head injury reporting effort likely,” Roberts said. “First, it’s hard to coordinate 50 states’ efforts. And second, if left to medical professionals, the survey tool might become so cumbersome that schools would be reluctant to participate – and certainly, it would not get the 99.9 percent cooperation that we’ve enjoyed from schools over these three years.”
Schools report possible concussions online via the MHSAA Website. Reports are then examined by members of the MHSAA staff, who follow up with school administrators as those student-athletes continue to receive care and eventually return to play. Student privacy is protected.
The reporting of possible concussions is part of a three-pronged advance by the MHSAA in concussion care begun during the 2015-16 school year. The MHSAA completed in spring 2017 the largest-ever state high school association sideline concussion testing pilot program, with a sample of schools from across the state over two years using one of two screening tests designed to detect concussions. The MHSAA also was the first state association to provide all participants at every member high school and junior high/middle school with insurance intended to pay accident medical expense benefits – covering deductibles and co-pays left unpaid by other policies – resulting from head injuries sustained during school practices or competitions and at no cost to either schools or families.
Previously, the MHSAA also was among the first state associations to adopt a return-to-play protocol that keeps an athlete out of activity until at least the next day after a suspected concussion, and allows that athlete to return to play only after he or she has been cleared unconditionally for activity by a doctor (M.D. or D.O.), physician’s assistant or nurse practitioner.
In addition, the MHSAA’s Coaches Advancement Program – which includes courses that must be completed by all varsity head coaches hired for the first time at a member school – provides substantial instruction on concussion care. Separately, rules meetings that are required viewing for high school varsity and subvarsity head and assistant coaches at the start of each season include detailed training on caring for athletes with possible head injuries.
March Magic Hoopfest Returns to MSU
March 17, 2014
By Geoff Kimmerly
Special to Second Half
March Magic Hoopfest will return to Jenison Field House for this weekend’s Michigan High School Athletic Association Boys Basketball Finals, marking the fifth championship weekend the event has run concurrent with the games being played at Michigan State University’s Breslin Center.
A number of favorite attractions will return including slam dunk (on lowered rims), 3-point shootout and full-court rainbow shot areas where fans can come at any time and participate. Also returning is the Walk of History, showcasing championship games, life-size photos and display boards from throughout the MHSAA Finals’ near century-long run. A large video screen will play a series of “Buzzer Beaters,” “Battle of the Fans” and other MHSAA-produced videos.
Two Hoopfest center courts will host a number of games throughout the event, including the “JumpBall Jamboree” made up of teams of boys and girls in grades 5-8, a wheelchair basketball tournament and a series between four Special Olympics Project UNIFY high school teams.
Admission to the March Magic Hoopfest is $2 per person, and fans attending the MHSAA Boys Basketball Semifinals and Finals will be admitted free with their game tickets. Hours on March 20 and 21 will be 2 p.m. to 7 p.m.; the event is open from 10 a.m. to 7 p.m. on March 22. Jenison Field House, site of Hoopfest, also was the site of the MHSAA Boys Basketball Finals for 31 years. To find out more general information about the event, visit the March Magic Hoopfest Website.
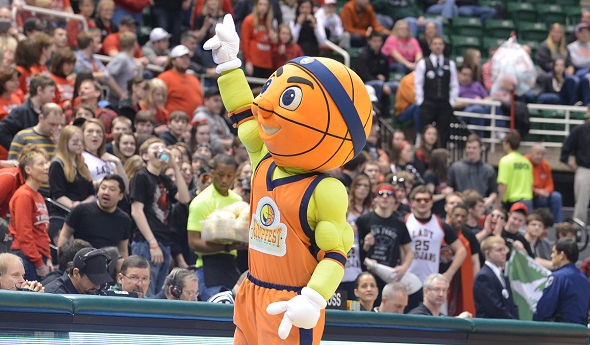
Hoopfest also will be home to Hoopie, the event’s mascot who made his first public appearances during the MHSAA Girls Basketball Finals. Click for video of Hoopfest’s newest volunteer as he helped prepare for this weekend’s event:
The March Magic Hoopfest is being conducted in a partnership between the Greater Lansing Sports Authority (GLSA), a division of the Greater Lansing Convention and Visitors Bureau; and the MHSAA, with vital support coming from the Department of Intercollegiate Athletics at Michigan State University.
“March Magic Hoopfest is a giant playground. There are opportunities for fun all over Jenison – and it’s a great way to spend an hour while waiting for the next round of games to start,” MHSAA Director of Brand Management Andy Frushour said. “All of us can remember reenacting games of our high school heroes. What better place to let kids do so now than across the street from Breslin Center in one of the most storied buildings in this state’s basketball history.”
The Greater Lansing Sports Authority’s mission is to be the leading voice of sports tourism in the Greater Lansing area and to promote economic growth by attracting a diverse range of sporting events to the region. The GLSA strives to enhance the quality of life for area residents through the development of local sports and fitness programs for all ages and supports the continued development and maintenance of safe, high-quality athletic facilities.
Hoopfest was not held at the 2013 Finals due to a Big Ten championship event being hosted by Jenison Field House.
"The GLSA is excited to partner with the MHSAA on the re-launch of March Magic Hoopfest," said Mike Price of the Greater Lansing Sports Authority. "While Hoopfest was absent in 2013, planning and improvement were ongoing. We are excited to showcase an improved Hoopfest that includes new games and activities, as well as the launch of our new mascot, Hoopie!”
PHOTO: Hoopie made his first public appearance during the weekend's MHSAA Girls Basketball Finals at the Breslin Center.