

MHSAA Ups Awareness with 'Heat Ways'
August 6, 2013
With the beginning of a new year for high school sports just a week away, members of the Michigan High School Athletic Association have been preparing to follow a new model policy for hot weather activity, guided by a new publication and a rules meeting emphasis on heat and hydration.
The MHSAA Representative Council adopted a Model Policy for Managing Heat & Humidity earlier this year, a plan many schools have since adopted at the local level. The plan directs schools to begin monitoring the heat index at the activity site once the air temperature reaches 80 degrees, and provides recommendations when the heat index reaches certain points, including ceasing activities when it rises above 104 degrees.
The model policy is outlined in a number of places, including a new publication called Heat Ways, which is available for download from the MHSAA Website. Heat Ways not only provides the model policy, but addresses the need for proper acclimatization in hot weather.
The topic of heat-related injuries receives a lot of attention at this time of year, especially when deaths at the professional, collegiate and interscholastic levels of sport occur, and especially since they are preventable in most cases with the proper precautions. In football, data from the National Federation of State High School Associations shows that 41 high school players have died from heat stroke between 1995 and 2012.
Even before the days of the Internet, the MHSAA held a leadership role in providing resources each Spring to assist schools in their preparation for hot preseason practices. In addition to the information now contained in Heat Ways, the Association is making dealing with heat, hydration and acclimatization the topic for its required preseason rules meetings for coaches and officials. The 15-minute online presentation spends a fair amount of time talking about the need for good hydration in sports, regardless of the activity or time of year.
The Health & Safety Resources page of the MHSAA Website has a set a number of links to different publications and information, and a free online presentation from the National Federation of State High School Associations. Visit MHSAA.com, click on Schools, and then on Health & Safety Resources to find the information.
“We know now more than we ever have about when the risk is high and who is most at risk, and we’re fortunate to be able to communicate that information better than ever before to administrators, coaches, athletes and parents," said John E. “Jack” Roberts, executive director of the MHSAA. “Heat stroke is almost always preventable, and we encourage everyone to avail themselves of the information on our website.”
Roberts added that the first days of formal practices in hot weather should be more for heat acclimatization than the conditioning of athletes, and that practices in such conditions need planning to become longer and more strenuous over a gradual progression of time.
“Then, schools need to be vigilant about providing water during practices, making sure that youngsters are partaking of water and educating their teams about the need for good hydration practices away from the practice and competition fields,” Roberts said.
Scholars and Athletes 2015: Class B
By
Geoff Kimmerly
MHSAA.com senior editor
February 9, 2015
By Geoff Kimmerly
Second Half editor
The Michigan High School Athletic Association has selected eight student-athletes from Class B member schools to receive scholarships through its Scholar-Athlete Award program.
 Farm Bureau Insurance, in its 26th year of sponsoring the award, will give $1,000 college scholarships to 32 individuals who represent their member schools in at least one sport in which the Association sponsors a postseason tournament. The first 30 scholarships are awarded proportionately by school classification and the number of student-athletes involved in those classes; also, there are two at-large honorees which can come from any classification.
Each of the scholarship recipients will be honored at halftime ceremonies of the Class C Boys Basketball Final game March 28 at the Breslin Student Events Center in East Lansing. Commemorative medallions will be given to the finalists in recognition of their accomplishments.
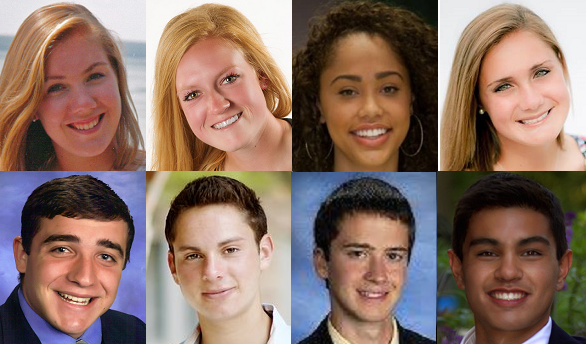
The Class B Scholar-Athlete Award honorees are: Kirstin Anderson, Charlotte; Kelsey Cushway, Big Rapids; Kalabrya LeBrae Gondrezick, Benton Harbor; Amanda Paull, Cheboygan; Jonathan Krug, New Boston Huron; Stephen Luckoff, Bloomfield Hills Cranbrook Kingswood; Dane Miller, Dearborn Divine Child; and Francis Misra, Bloomfield Hills Cranbrook Kingswood.
Overviews of the scholarship recipients of the Class B Scholar-Athlete Award follow. A quote from each recipient's essay also is included:
Kirstin Anderson, Charlotte
Played two seasons each of varsity volleyball and basketball and will run her fourth this spring of track and field; also ran varsity cross country as a sophomore. Served as co-captain of both the volleyball and basketball teams as a senior and earned all-conference honorable mention in the fall in addition to all-state all-academic honors. Participating in second year of National Honor Society and this school year as vice president. Attained level of AP Scholar with Honor based on her scores on College Board Advanced Placement exams. Served on student council all four years of high school and also performed four years in her marching, concert and symphony bands; named drum major two years and section leader in the symphony band as a senior. Also participated in Harvard Model Congress, MyLead Leadership and the Rotary International Leadership Camp, and co-created her school’s chapter of the Rotary Interact teen service organization. Will attend Hope College and study business and political science.
Essay Quote: “Sportsmanship, at its heart, is not about the person exhibiting it. It is about the effects it has on the people around him or her. Sportsmanship is an intangible quality that makes an athlete instantly admirable and recognizable.”
Kelsey Cushway, Big Rapids
Played two seasons of varsity volleyball, varsity basketball as a junior, and will play her fourth season of varsity softball and first of varsity soccer this spring. Will serve as softball captain for the third season and earned all-league honors in that sport. Helped volleyball team to a District title in the fall. Serving fourth year in student government with terms as mayor and secretary of the executive board. Played in marching band and chamber ensembles all four years and is a two-year section leader; received division one performance ratings at district and state levels. Participated in National Honor Society the last two years, serving as president, and in Key Club, Students Against Destructive Decisions and her school’s “Climate Crew” community outreach group. Will attend either the University of Chicago or Western Michigan University, and plans to study biomedical sciences.
Essay Quote: “When dealing with all of these experiences, we are given the chance to develop our character in a way that produces a confident yet humble competitor. The ability to embody not only a gracious winner but an equally accepting loser is one that signifies the importance of sportsmanship within educational athletics.”
Kalabrya LeBrae Gondrezick, Benton Harbor
Playing fourth season of varsity basketball, played one of varsity volleyball and ran one season of varsity cross country. Served as basketball team’s captain three seasons and has earned all-state honors after her first three. Also has earned academic honor awards three times and served as the cross country team’s captain. Has served as her class president all four years and participated all four in National Honor Society; is on pace to graduate as her class’ valedictorian. Named semifinalist for the national Coca-Cola Scholarship Program award. Presented at national seminar as part of Michigan’s Safe and Supportive Schools initiative and served on the Benton Harbor Teen Advisory Council. Also served as a peer mediation leader all four years and participated in the Delta Sigma Theta Sorority’s Delta Gems for four years. Will attend Michigan State University to study communications and has signed a letter of intent to play basketball.
Essay Quote: “I honor competition by being an ambassador on and off the court. Compete like a warrior with the class of a lady. … The character of sportsmanship will lose its identity if student-athletes don’t wear sportsmanship in their performance and voice of leadership.”
Amanda Paull, Cheboygan
Ran four years of varsity cross country and will play her fourth season of varsity soccer this spring; also played on the varsity hockey team as a sophomore. Finished among top two in her conference every season of cross country and placed among the top 48 of her MHSAA Finals all four seasons with a best of 28th as a freshman. Made all-state in soccer as a junior after earning honorable mentions her first two seasons. Also earned academic varsity letters all four years of high school and is a two-year member of the National Honor Society. Served on her school’s student council her first two years of high school and on the MHSAA’s Student Advisory Council the last two years. Selected for Rotary International’s leadership camp. Competed on a national-qualifying DECA business club team as a junior. Will attend Ferris State University to study biology with an emphasis on pre-dentistry; also has signed a letter of intent to play soccer.
Essay Quote: “Whether it be shaking your opponent’s hand after a game, encouraging a fellow runner or rallying and coming together as a sports community, sportsmanship is important on all levels reminding us why we play: because we love it.”
Jonathan Krug, New Boston Huron
Played three seasons of varsity football and will run his third season of track and field this spring. Captained the football team to District and Regional championships in the fall and led the team in tackles in earning all-state honors. Served on student council the last three years and participated in National Honor Society the last two. Also participating in Quiz Bowl and Students Against Destructive Decisions this school year. Served as a middle school mentor for three years as part of his school’s Fuel Youth Group and also served as a team leader on various youth group mission trips and for the Downriver Middle School youth group. Will attend of the University of Michigan at Dearborn and study engineering.
Essay Quote: “This past season I had 65 tackles, and for every single one of those tackles, I lent a hand and picked up the person who I tackled. When I would do this, the other team would be surprised and actually thanked me for helping them. I did this because I wanted to show the other team that I am human too, and I understand what it means to get knocked down.”
Stephen Luckoff, Bloomfield Hills Cranbrook Kingswood
Played four seasons of varsity soccer and will play his fourth of varsity lacrosse this spring; also played varsity basketball as a junior. Served as soccer team’s captain and earned all-state second-team honors. Served as president and lead facilitator of Bridge the Divide Club uniting those living in Detroit and its suburbs and is participating as a youth intern for the second year for the Michigan Roundtable for Diversity & Inclusion. Founded Motor City Lacrosse and volunteered four years for the Miracle League Baseball Organization. Served as head student leader of Horizons-Upward Bound tutoring program and volunteered four years for Feedom Freedom urban farming program. Will attend the University of Michigan and study finance.
Essay Quote: “For many, many years, I was blinded by the final results of my games and matches, blinded from the true meaning of my athletics. My tunnel vision made it very difficult for me to step out of my own shoes and fully embed myself with the morals and knowledge that athletics can teach. … As I move forward with my life, I seek to cherish every moment I have, every relationship I create, and every step I take.”
Dane Miller, Dearborn Divine Child
Ran four years of varsity cross country and will run fourth of varsity track and field this spring. Served as cross country team captain the last two seasons and helped it to three Regional titles over four seasons while earning all-area and academic all-state honors the last two. Helped track and field team to a Regional title in 2012 and earned all-area recognition last season. Attained AP Scholar with Honor and National Merit Scholar Commended Student recognitions and achieved a perfect score (36) on his ACT college entrance exam. Also named a National Hispanic Recognition Program scholar and participated two years in Sociedad Honoraria Hispanica. Tutored all four years at Kumon Math and Reading Center and raised nine puppies for Leader Dogs for the Blind. Will attend the University of Michigan and study electrical engineering.
Essay Quote: “I have always had an idea of what sportsmanship is and the importance for it in athletics. However, I was never able to fully wrap my mind around what it really meant until I experienced a devastating failure as a freshman. … This experience taught me a valuable lesson about sportsmanship: the importance of putting others before myself.”
Francis Misra, Bloomfield Hills Cranbrook Kingswood
Swimming his fourth season on his school’s varsity, this winter as captain. Qualified for the MHSAA Finals his first three seasons, helping the Cranes to their first MHSAA team championship, in Lower Peninsula Division 3, last season. Earned all-state honors in seven events over three seasons; swam as part of the winning 200-yard medley relay in 2014. Also swam to four individual league titles and as part of four relays that won championships. Founded a team for National Kidney Foundation walk that raised more than $18,000, and also recruited a combined 180 walkers for multiple fundraising events. Volunteered for Horizons-Upward Bound as a swim instructor and academic tutor, and as a swim instructor for his local Make a Splash program; also volunteered for Special Olympics Swim-a-Thon. Earned his school’s Shin/Welch Award “for outstanding leadership and citizenship.” Will attend the University of Michigan and study film production.
Essay Quote: “I thought that winning feeling I shared amongst my teammates was the best I could ever feel. But I was wrong. … My teammates and I realized that sportsmanship extends beyond the athletic arena.”
Other Class B girls finalists for the Scholar-Athlete Award were: Kendall Latshaw, Battle Creek Harper Creek; Shelby Bowers, Coldwater; Riley Blair, Dearborn Divine Child; Rebecca Piron, Escanaba; Raven Jefferson-Brinkley, Ferndale; Morgan Ketola, Freeland; Rachel Money, Grayling; Courtney Vande Vorde, Hamilton; Kikel Sekoni, Haslett; Kristen Marsman, Holland Christian; Jenna Davids, Portland; and Kelsey Metzger, Sturgis.
Other Class B boys finalists for the Scholar-Athlete Award were: Samuel Swem, Buchanan; T.J. Baker, Cadillac; Derek Sturvist, Cheboygan; Tyler James Burkhardt, Fowlerville; Andrew Olesak, Gladstone; Bradley Madsen, Manistee; Tyler Horn, Marshall; Chandler Biggs, Midland Bullock Creek; Jacob Almeda, Plainwell; Trenton L. Monroe, Plainwell; Mark Williamson, Spring Lake; and Garrett Bondy, Yale.
Students applying for the Scholar-Athlete Award must be carrying at least a 3.5 (on a 4.0 scale) grade-point average and have previously won a letter in a varsity sport in which the Michigan High School Athletic Association sponsors a postseason tournament. Other requirements for the applicants were to show active participation in other school and community activities and produce an essay on the importance of sportsmanship in educational athletics.
The Class C and D scholarship award recipients were announced Feb. 3, and the Class A honorees will be announced Feb. 17.
Farm Bureau Insurance, one of Michigan's major insurers, has a statewide force of 450 agents serving nearly 500,000 Michigan policyholders. Besides providing life, home, auto, farm, business and retirement insurance, the company also sponsors life-saving, real-time Doppler weather tracking systems in several Michigan communities.
The MHSAA is a private, not-for-profit corporation of voluntary membership by more than 1,400 public and private senior high schools and junior high/middle schools which exists to develop common rules for athletic eligibility and competition. No government funds or tax dollars support the MHSAA, which was the first such association nationally to not accept membership dues or tournament entry fees from schools. Member schools which enforce these rules are permitted to participate in MHSAA tournaments, which attract more than 1.4 million spectators each year.