

Participation Rises in 2015-16
June 30, 2016
By Geoff Kimmerly
Second Half editor
Despite another slight decline in enrollment at Michigan High School Athletic Association member high schools for the 2015-16 school year, participation in sports rose for the first time since 2010-11 as a total of 284,227 participants took part in the 28 sports for which postseason tournaments are sponsored by the MHSAA.
This year’s 0.71 percent dip in enrollment at member schools is the latest in a steady decrease that has seen enrollment fall nearly 12 percent total since 2006-07; however, participation in MHSAA-sponsored sports was up 0.57 percent over 2014-15. A total of 15 sports saw participation increases from the school year before, with boys and girls bowling, boys cross country and girls lacrosse setting records.
Girls participation was up 1.7 percent to 119,281 participants, despite a fall in girls enrollment of sixth tenths of a percent. Boys participation did fall a slight two tenths of a percent, to 164,946 participants, but boys enrollment fell eighth tenths of a percent from the previous school year. The overall MHSAA totals count students once for each sport in which they participate, meaning students who are multiple-sport athletes are counted more than once.
Girls lacrosse continued its streak of setting a participation record every season since becoming a sponsored tournament sport in 2005, this time with a 7.2 increase in participation to 2,775 athletes. Boys bowling saw a 3.7 percent increase this season to a record total of 3,860 athletes, while girls bowling was up 2.6 percent for a record total of 3,047. Boys cross country set a record for the second time in three seasons, this time up 5.3 percent with 9,254 runners.
A number of sports experienced bounce-backs from decreases over recent years. Boys basketball (0.5 percent increase to 21,524 athletes) was up after two straight years of decreases, while girls softball (5.2 percent increase to 13,788 athletes) was up after four straight years of lowering numbers. Boys track & field had seen participation decrease six straight seasons before bouncing back 1.6 percent this spring with 22,803 athletes, and wrestling also came back from six straight seasons of decreases with a 1.3 percent increase to 9,601 athletes. Girls volleyball just edged girls lacrosse for the largest increase of any MHSAA-sponsored sport in 2015-16, jumping 7.8 percent with 19,395 athletes after three straight seasons of declining participation.
Other sports with increased participation in 2015-16 were girls cross country (0.6 percent to 8,403 athletes), girls golf (3.8 percent to 3,460), girls gymnastics (3.2 percent to 638), boys soccer (1.0 percent to 14,574), girls soccer (0.3 percent to 13,367) and girls tennis (0.5 percent to 8,675).
However, a few troubling trends did continue. Girls basketball participation fell for the 10th straight season, this time nearly a percent to 15,558 athletes, the sport’s lowest total since records first were kept in 1991-92. The latest decrease brings the total fall in participation to 18.7 percent in that sport since a U.S. District Court decision led to the switching of girls basketball season from fall to winter beginning in 2007-08. Comparatively, girls enrollment at MHSAA schools during that time has fallen 12.1 percent. Although volleyball, the sport that swapped seasons with girls basketball and moved to fall, saw a large increase in 2015-16, its total number of athletes still was the third-lowest for the sport since 1993-94 and its participation is still down 10 percent since the seasons changed.
Also of note in this year’s survey:
• The increase in participation for 15 sports with a decrease in 13 was compared to an increase for only eight and decrease for 20 in 2014-15. Those increases and decreases were split evenly across boys and girls sports last school year; this school year, six boys sports were up and eight were down in participation, while nine girls sports were up and only five saw decreases.
• For the second straight year, a slight decrease in football participation fell in line with the slight decrease in boys enrollment after larger drops previously. Football participation was down 1.4 percent for the second straight year (and slowed this time a few hundredths of a percent, from 1.44 in 2014-15 to 1.42). The drop in football participation from 2011-12 to 2012-13 was 3.7 percent, and the drop from 2012-13 to 2013-14 was two percent.
• Skiing saw the largest combined decrease among pairs of related sports, with boys participation down 7.2 percent to 719 and girls down 2.8 percent to 652 after both experienced increases a year ago. Swimming & diving experienced decreases for both girls and boys together for the second straight year, although this time the decreases were smaller than in 2014-15; girls were down 4.3 percent to 5,378 athletes and boys were down 4.2 percent to 4,732.
• Boys golf participation fell for the seventh straight season, four percent to 6,271 athletes, its lowest total on record. Boys tennis experienced its seventh straight decrease to 6,077 athletes, also the lowest total on record for that sport and a dip of 3.6 percent from 2014-15.
• Baseball, after three straight seasons of increases, was down just less than a percent this spring. Boys lacrosse, after setting a participation record in 2013-14, was down for the second straight year but this time by only six athletes, or one tenth of a percent. Girls track & field was down for the second straight year, by 1.5 percent, after three straight of increases.
The participation figures are gathered annually from MHSAA member schools to submit to the National Federation of State High School Associations for compiling of its national participation survey. Results of Michigan surveys from the 2000-01 school year to present may be viewed on the MHSAA Website.
The following chart shows participation figures for the 2015-16 school year from MHSAA member schools for sports in which the Association sponsors a postseason tournament:
|
Boys |
|
Girls |
|
|
SPORT |
SCHOOLS (A) |
PARTICIPANTS |
SCHOOLS (A) |
PARTICIPANTS (B) |
|
Baseball |
635/654/5 |
18,173 |
- |
0/6 |
|
Basketball |
728/735/4 |
21,509 |
653/722 |
15,558/15 |
|
Bowling |
369/382/4 |
3,853 |
350/374 |
3,047/7 |
|
Competitive Cheer |
- |
- |
336/350 |
7,062 |
|
Cross Country |
615/641/1 |
9,252 |
597/636 |
8,403/2 |
|
Football - 11 player |
595/627/81 |
38,500 |
- |
0/92 |
|
8-player |
47/49/1 |
927 |
- |
1 |
|
Golf |
497/532/42 |
6,197 |
334/340 |
3,460/74 |
|
Gymnastics |
- |
- |
67/76 |
638 |
|
Ice Hockey |
227/260/5 |
3346 |
- |
0/6 |
|
Lacrosse |
137/143/4 |
4,948 |
97/99 |
2,775/4 |
|
Skiing-Alpine |
85/100/0 |
719 |
92/102 |
652/0 |
|
Soccer |
474/497/15 |
14,526 |
456/477 |
13,367/48 |
|
Softball-Fast Pitch |
- |
- |
612/639 |
13,788 |
|
Swimming & Diving |
238/271/0 |
4,732 |
253/281 |
5,378/0 |
|
Tennis |
293/309/3 |
6,065 |
331/344 |
8,675/12 |
|
Track & Field - Outdoor |
662/686/0 |
22,803 |
646/685 |
16,611/0 |
|
Volleyball |
- |
- |
708/719 |
19,395 |
|
Wrestling |
463/480/130 |
9,396 |
- |
0/205 |
(A) The first number is the number of schools reporting sponsorship on the Sports Participation Survey. The second number indicates schools sponsoring the sport including primary and secondary schools in cooperative programs as of May 7, 2016. The third number indicates the number of schools that had girls playing on teams consisting primarily of boys.
(B)The second number indicates the number of additional girls playing on teams consisting primarily of boys and entered in boys competition.
The MHSAA is a private, not-for-profit corporation of voluntary membership by more than 1,400 public and private senior high schools and junior high/middle schools which exists to develop common rules for athletic eligibility and competition. No government funds or tax dollars support the MHSAA, which was the first such association nationally to not accept membership dues or tournament entry fees from schools. Member schools which enforce these rules are permitted to participate in MHSAA tournaments, which attract more than 1.4 million spectators each year.
NFHS Introduces Updated Logo
July 17, 2019
Special from NFHS
As the National Federation of State High School Associations (NFHS) heads into the next 100 years of leading high school sports and other activity programs nationwide, it will be doing so with a new logo.
 The new logo was unveiled to the membership earlier this month at the close of the NFHS Centennial Celebration. The NFHS and its 51-member state high school associations celebrated the organization’s accomplishments at the 100th Annual Meeting at the JW Marriott in downtown Indianapolis.
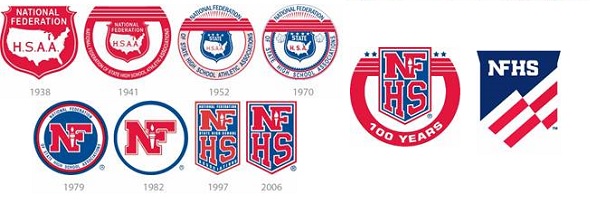
The organization will continue to be branded as the NFHS in the new logo, and the N and F are connected as has been the case since 1979. However, the entire acronym is together on one line as opposed to the previous logo with the NF and HS on separate lines. While red and blue will continue to be the predominant colors, the new logo mixes white with red and blue to suggest a flag waving in the wind. The direction of the flag is pointing upward to symbolize forward-thinking and advancement.
The new design maintains a resemblance to the shield that has been a part of the NFHS logo since 1997. However, the logo is flared at the top, and the bottom of the logo does not have definitive borders, which suggests the organization has moved past its first 100 years and is expanding its reach as the national leadership organization for high school sports and performing arts programs in the United States.
While the organization’s logo from 1952 had four stars to signify the four charter members of the NFHS, the four stripes within the new logo represent the four homes of the organization during the first 100 years.
“We wanted to retain NFHS as the central component of the new logo because the organization’s national presence has continued to spiral upward in the 22 years since the NFHS acronym was adopted,” said Dr. Karissa Niehoff, NFHS executive director. “However, as we celebrated our first 100 years, we felt it was important to establish a new look that would signify our ever-increasing role as the national leader in high school sports and performing arts programs.”
Counting the Centennial logo that was used during the 2018-19 school year, the new logo will be 10th used by the organization since the first one was adopted in the 1930s. The new logo was created by Section 127, an Indianapolis-based design company.
The NFHS was started in 1920 and had offices in Chicago until 1971, when it moved to Elgin, Illinois. The organization moved to Kansas City, Missouri, in 1979, and then in 2000 to Indianapolis, where it remains today.
The Michigan High School Athletic Association is a member of the NFHS, and Michigan is one of the four founding states of the national association.