

2018-19 Concussion Data Reinforces Trends
September 26, 2019
By Geoff Kimmerly
Second Half editor
Data on student-athlete concussions collected by the Michigan High School Athletic Association from member high schools during the 2018-19 school year further reinforced findings from the first three years of reporting, and will contribute significantly as a number of MHSAA-associated groups work during the coming year to reduce the incidence of those injuries.
The 2018-19 concussion report found student-athletes at MHSAA member high schools encountered a total of 3,686 head injuries during the past school year – 3.0 percent more than in 2017-18. But that slight increase barely affected two key ratios. The number of injuries per member school was 4.9, up just a tenth of a percent from 2017-18, and for the second straight year only 1.3 percent of participants in MHSAA sports experienced a head injury, still down from 1.4 in 2016-17 and 1.6 percent the first year of the study. Total participation in MHSAA sports for 2018-19 was 281,992 – with students counted once for each sport they played.
The MHSAA has continued to invite Michigan’s universities, health care systems and the National Federation of State High School Associations (NFHS) to take part in analyzing the data and resulting questions that have arisen during the past three years. The 2018-19 results will be examined by the MHSAA’s newly-formed Sports Medicine Advisory Committee and also undergo analysis by representatives of Michigan State University’s Institute for the Study of Youth Sports. Furthermore, the MHSAA is directing its sport committees to study the data as they consider adjustments that could be made to rules for practice and competition.
“The 2018-19 concussion survey further reinforced the findings and trends we have seen emerge; not only in specific sports, but across all of our activities – and this latest set of results also raises new questions,” MHSAA Executive Director Mark Uyl said. “We must continue to look at how changes to playing rules and improvements in equipment may be beneficial moving forward, and also how we can further educate administrators, coaches, athletes and parents to identify and provide treatment for these injuries as soon as possible. We also are excited for the opportunity to have more eyes on these results as we continue to explore more ways to make our games safer.”
As first mandated in 2015-16, member schools are required to report head injuries to the MHSAA identifying the sport that each student-athlete was participating in and whether the injury was sustained during practice or competition. Schools also are required to designate at which level – varsity, junior varsity or freshman – the injury occurred.
The full report of all head injuries experienced during 2018-19 by student-athletes at MHSAA member high schools – including percentages by sport (per 1,000 participants), gender and team level, as well as data tracking when athletes returned to play – is available on the Health & Safety page of the MHSAA Website.
Keeping with the first three years of this survey, the MHSAA continued to receive data from more than 99 percent of its member high schools after the fall, winter and spring seasons. Member junior high and middle schools also were allowed, although not mandated, to report their head injuries; and those findings are not part of the published report.
Boys in 2018-19 experienced 2,404 – or 65 percent – of concussion injuries, just a percent less than during 2017-18, and not surprisingly as boys have a much higher participation in contact sports. More than half of head injuries – 59 percent – were experienced by varsity athletes, a slight increase of three percent from the previous year. A total of 2,441 head injuries – or 66 percent – came in competition as opposed to practice. Just more than half took place during either the middle of practice or middle of competition as opposed to the start or end, and 51 percent of injuries were a result of person-to-person contact.
The MHSAA also asked schools to report the number of days between the head injury and the athlete’s return to activity – and the two largest groups returned to activity after either 6 to 10 days of rest (24 percent) or 11 to 15 days (23 percent). All of these findings were within 1-3 percent of those discovered from the 2017-18 data.
Contact sports again revealed the most head injuries. Ranking first was football, 11 and 8-player combined, with 44 head injuries per 1,000 participants – an increase of three per 1,000 from 2017-18 but the same ratio as 2016-17 and still down from 49 head injuries per 1,000 football participants shown by the first study in 2015-16. Ice hockey again revealed the second-most injuries per 1,000, with 35 (also up three from a year ago but still down from 36 injuries per 1,000 from 2016-17 and 38 per 1,000 in 2015-16), and girls soccer was third with 25 head injuries per 1,000 participants for the second year in a row. Wrestling followed with 22 head injuries per 1,000 participants.
Continuing a noticeable trend of the last few years, the next three sports to show the highest incidences of head injuries were girls sports – girls lacrosse, competitive cheer and basketball also revealed 20 per 1,000 participants, although basketball was down two injuries per 1,000 participants or nearly 10 percent from the previous year. Boys lacrosse (16), boys soccer (14), girls volleyball (11), softball (11) and gymnastics (10) also showed double-digit head injuries per 1,000 participants.
Females again reported significantly more concussions than males playing the same or similar sports – soccer, basketball and baseball/softball. Female soccer players reported nearly double the concussions per 1,000 participants as male soccer players (25 to 14), while female basketball players reported nearly triple the number of concussions per 1,000 participants (20 to 7). Softball players also reported nearly triple the concussions per 1,000 participants of baseball players (11 to 4).
Schools report possible concussions online via the MHSAA Website. Reports are then examined by members of the MHSAA staff, who follow up with school administrators as those student-athletes continue to receive care and eventually return to play. Student privacy is protected.
The reporting of concussions is part of a three-pronged advance by the MHSAA in concussion care begun during the 2015-16 school year. The MHSAA completed in spring 2017 the largest-ever state high school association sideline concussion testing pilot program, with a sample of schools from across the state over two years using one of two screening tests designed to detect concussions. The MHSAA also was the first state association to provide all participants at every member high school and junior high/middle school with insurance intended to pay accident medical expense benefits – covering deductibles and co-pays left unpaid by other policies – resulting from head injuries sustained during school practices or competitions and at no cost to either schools or families.
Previously, the MHSAA also was among the first state associations to adopt a return-to-play protocol that keeps an athlete out of activity until at least the next day after a suspected concussion, and allows that athlete to return to play only after he or she has been cleared unconditionally for activity by a doctor (M.D. or D.O.), physician’s assistant or nurse practitioner.
In addition, the MHSAA’s Coaches Advancement Program – which includes courses that must be completed by all varsity head coaches hired for the first time at a member school – provides substantial instruction on concussion care. Separately, rules meetings that are required viewing for high school varsity and subvarsity head and assistant coaches at the start of each season include detailed training on caring for athletes with possible head injuries.
2026 MHSAA Football Playoff Pairings Announced
By
Geoff Kimmerly
MHSAA.com senior editor
October 25, 2026
Here are the pairings for the 2026 MHSAA Football Playoffs, which begin Oct. 30 and 31 with District Semifinals in the 11-Player Playoffs and Regional Semifinals in the 8-Player Playoffs.
Teams were divided into divisions before the start of play this fall. The top 32 teams in each division in 11-player and top 16 per division in 8-player, based on playoff-point average, were selected to the field.
For 11-player, qualifiers were then divided into four regions with eight teams apiece, then placed into four-team Districts based on their seeds within the region. The 8-player qualifiers were divided into four regions with four teams in each.
Pairings for the first three weeks of the tournament are based on regular-season playoff-point averages, with the highest-ranked team hosting, regardless of the distance between the two schools. For 11-Player District Semifinals, the top-seeded team will host the eighth-seeded team, the second-seeded will host the seventh-seeded, the third-seeded with host the sixth-seeded, and the fourth-seeded team will host the fifth-seeded team. For 8-Player Regional Semifinal play, the top-seeded team in each bracket will host the fourth-seeded team, and the second-seeded team will host the third-seeded team.
District Finals for 11-player and Regional Finals for 8-player will follow during the weekend of Nov. 6-7, and the weekend of Nov. 13-14 will have Regional Finals in the 11-Player Playoffs and Semifinals in the 8-Player Playoffs. The 8-Player Semifinals will pair the winners of Region 1 vs. Region 2 and the winners of Region 3 vs. Region 4 at neutral sites assigned by the MHSAA.
Semifinal games in the 11-Player Playoffs will take place Nov. 20-21, pairing the winners of Region 1 vs. Region 2 and the winners of Region 3 vs. Region 4. The MHSAA also will assign 11-Player Semifinals at neutral sites.
All playoff tickets except for Finals (both 11 and 8-player) will be sold online only via GoFan.
For 11-Player, tickets to District Semifinals and District Finals cost $8, tickets to Regional Finals are $10, and tickets to Semifinals cost $12. For 8-player, tickets for Regional Semifinals are $8, tickets for Regional Finals are $10, and tickets for Semifinals cost $12.
The 8-Player Finals will take place Nov. 21 at Northern Michigan University’s Superior Dome in Marquette, and the 11-Player Finals will be played Nov. 27 and 28 at Ford Field in Detroit. An all-day ticket for 8-Player Finals costs $12 and includes admission to both games, and an all-day ticket for the 11-Player Finals costs $20 and includes admission to that day’s four games.
The 11-Player Finals schedule will be as follows:
Friday, Nov. 27
9:30 a.m. - Division 8
12:30 p.m. - Division 4
4 p.m. - Division 6
7 p.m. - Division 2
Saturday, Nov. 28
9:30 a.m. - Division 7
12:30 p.m. - Division 3
4 p.m. - Division 5
7 p.m. - Division 1
Pairings for both the 11 and 8-Player brackets are as follows:
11-Player Pairings
DIVISION 1
REGION 1
DISTRICT 1
Grandville (4-5) 54.778 at Howell (9-0) 87.000
Hudsonville (6-3) 66.778 at Portage Central (8-1) 72.667
DISTRICT 2
Brighton (5-4) 58.000 at East Kentwood (9-0) 83.667
Rockford (5-4) 61.444 at Grand Ledge (9-0) 75.111
REGION 2
DISTRICT 1
Bloomfield Hills (5-4) 52.222 at Clarkston (8-1) 82.889
Hartland (7-2) 71.556 at Grand Blanc (9-0) 78.139
DISTRICT 2
Lake Orion (4-5) 53.889 at Detroit Catholic Central (8-1) 79.681
Davison (7-2) 63.583 at Oxford (7-2) 78.778
REGION 3
DISTRICT 1
Plymouth (4-5) 51.333 at Detroit Cass Tech (9-0) 76.861
Belleville (6-3) 70.667 at Dearborn Fordson (7-2) 71.333
DISTRICT 2
Dearborn (5-4) 55.667 at Saline (9-0) 76.778
Brownstown Woodhaven (7-2) 66.000 at Northville (7-2) 74.000
REGION 4
DISTRICT 1
New Baltimore Anchor Bay (5-4) 54.778 at Romeo (9-0) 83.667
Macomb Dakota (5-4) 64.667 at Rochester (6-3) 67.444
DISTRICT 2
Macomb L'Anse Creuse North (6-3) 54.889 at Rochester Hills Stoney Creek (7-2) 72.111
Utica (6-3) 56.444 at Rochester Adams (6-3) 70.000
DIVISION 2
REGION 1
DISTRICT 1
Muskegon (4-5) 47.444 at Byron Center (7-2) 71.667
Portage Northern (5-4) 59.000 at Traverse City West (6-3) 63.889
DISTRICT 2
East Lansing (4-5) 48.667 at Caledonia (7-2) 70.903
Traverse City Central (4-5) 49.667 at Muskegon Mona Shores (8-1) 69.833
REGION 2
DISTRICT 1
Midland (4-5) 47.222 at Milford (8-1) 73.333
Walled Lake Western (7-2) 65.333 at Midland Dow (7-2) 66.222
DISTRICT 2
Flushing (5-4) 49.778 at South Lyon (7-2) 72.000
Saginaw Heritage (6-3) 60.917 at South Lyon East (7-2) 68.333
REGION 3
DISTRICT 1
Roseville (4-5) 53.778 at Bloomfield Hills Brother Rice (7-2) 66.889
North Farmington (6-3) 59.111 at Ferndale (7-2) 61.000
DISTRICT 2
Birmingham Groves (5-4) 54.556 at Orchard Lake St. Mary's (6-3) 65.667
Birmingham Seaholm (5-4) 56.444 at St. Clair Shores Lakeview (7-2) 62.111
REGION 4
DISTRICT 1
Detroit Mumford (5-4) 47.333 at Gibraltar Carlson (9-0) 77.444
Livonia Franklin (7-2) 63.111 at Allen Park (7-2) 64.111
DISTRICT 2
Dearborn Heights Crestwood (5-4) 53.556 at Grosse Pointe South (8-1) 71.889
Livonia Churchill (5-4) 54.889 at Temperance Bedford (7-2) 64.889
DIVISION 3
REGION 1
DISTRICT 1
Petoskey (6-3) 49.556 at Mount Pleasant (8-1) 69.556
Marquette (6-3) 54.000 at Cadillac (7-2) 58.222
DISTRICT 2
Lowell (6-3) 53.556 at DeWitt (7-2) 67.111
East Grand Rapids (6-3) 53.556 at Coopersville (8-1) 65.556
REGION 2
DISTRICT 1
Zeeland East (5-4) 45.889 at St. Joseph (7-2) 65.889
Coldwater (6-3) 48.333 at Middleville Thornapple Kellogg (6-3) 52.556
DISTRICT 2
Niles (4-5) 46.111 at Zeeland West (7-2) 61.972
Battle Creek Central (5-4) 47.556 at Battle Creek Harper Creek (6-3) 52.889
REGION 3
DISTRICT 1
Waterford Mott (5-4) 47.111 at Chelsea (9-0) 70.556
Linden (6-3) 56.889 at Redford Thurston (8-1) 57.111
DISTRICT 2
Dexter (4-5) 52.444 at Mason (8-1) 67.000
Holly (7-2) 55.444 at Fenton (7-2) 64.333
REGION 4
DISTRICT 1
New Boston Huron (6-3) 48.000 at Port Huron (9-0) 75.222
Warren De La Salle Collegiate (5-4) 55.524 at Trenton (5-4) 57.000
DISTRICT 2
Warren Fitzgerald (6-3) 48.556 at Harper Woods (7-2) 72.333
Grosse Pointe North (6-3) 52.333 at Detroit Martin Luther King (6-3) 66.556
DIVISION 4
REGION 1
DISTRICT 1
Grand Rapids Christian (4-5) 43.667 at Grand Rapids Kenowa Hills (8-1) 66.333
Fruitport (7-2) 47.778 at Ludington (7-2) 48.111
DISTRICT 2
Big Rapids (5-4) 44.111 at Ada Forest Hills Eastern (8-1) 60.556
Spring Lake (5-4) 46.333 at Hudsonville Unity Christian (5-4) 52.778
REGION 2
DISTRICT 1
Vicksburg (7-2) 58.889 at Edwardsburg (9-0) 66.111
Paw Paw (8-1) 62.778 at Portland (9-0) 63.778
DISTRICT 2
Hastings (7-2) 60.556 at Stevensville Lakeshore (8-1) 66.000
Marshall (8-1) 60.889 at Grand Rapids South Christian (8-1) 65.222
REGION 3
DISTRICT 1
Williamston (5-4) 45.444 at Goodrich (9-0) 66.667
Ortonville Brandon (6-3) 49.556 at St. Johns (7-2) 51.222
DISTRICT 2
Lansing Sexton (6-3) 46.333 at Dearborn Divine Child (8-1) 63.556
Tecumseh (6-3) 49.000 at Adrian (8-1) 59.778
REGION 4
DISTRICT 1
Detroit Southeastern (6-3) 45.667 at Marysville (5-4) 52.556
Macomb Lutheran North (8-1) 50.556 at Detroit East English (7-2) 51.333
DISTRICT 2
St. Clair (7-2) 47.444 at Detroit Cody (8-1) 52.556
Detroit Country Day (6-3) 48.000 at Madison Heights Lamphere (5-4) 51.667
DIVISION 5
REGION 1
DISTRICT 1
Howard City Tri County (5-4) 38.222 at Kingsford (9-0) 56.889
Negaunee (5-4) 40.556 at Shepherd (7-2) 46.222
DISTRICT 2
Remus Chippewa Hills (7-2) 39.778 at Muskegon Orchard View (7-2) 49.222
Reed City (6-3) 40.111 at Ogemaw Heights (7-2) 46.778
REGION 2
DISTRICT 1
Comstock Park (4-5) 38.111 at Grand Rapids Catholic Central (7-2) 65.194
Berrien Springs (8-1) 51.333 at Lake Odessa Lakewood (8-1) 54.000
DISTRICT 2
Wyoming Godwin Heights (7-2) 47.667 at Grand Rapids West Catholic (7-2) 59.556
Kalamazoo Hackett Catholic Prep (9-0) 48.613 at Hopkins (8-1) 56.000
REGION 3
DISTRICT 1
Whitmore Lake (6-3) 39.000 at Frankenmuth (8-1) 56.222
Armada (5-4) 45.889 at Flint Powers Catholic (7-2) 48.667
DISTRICT 2
Pontiac Notre Dame Prep (5-4) 40.333 at Saginaw Swan Valley (8-1) 52.889
Corunna (4-5) 41.222 at Imlay City (7-2) 49.222
REGION 4
DISTRICT 1
Flat Rock (3-6) 33.444 at Monroe Jefferson (8-1) 55.556
Ida (7-2) 43.444 at Detroit Voyageur College Prep (6-3) 43.819
DISTRICT 2
Ann Arbor Father Gabriel Richard (5-4) 40.222 at Romulus Summit Academy North (6-3) 49.778
Detroit Denby (6-3) 40.444 at Redford Union (5-4) 46.000
DIVISION 6
REGION 1
DISTRICT 1
Mason County Central (5-4) 31.222 at Kingsley (9-0) 49.806
Calumet (6-3) 39.000 at Traverse City St. Francis (6-3) 41.000
DISTRICT 2
Elk Rapids (6-3) 33.986 at Sanford Meridian (9-0) 49.278
Harbor Springs (8-1) 36.778 at Gladwin (5-4) 43.444
REGION 2
DISTRICT 1
Flint Elite (5-4) 32.444 at Almont (9-0) 61.111
Midland Bullock Creek (5-4) 37.278 at Algonac (6-3) 41.667
DISTRICT 2
New Haven (6-3) 34.111 at Marine City (9-0) 56.667
Durand (6-3) 35.667 at Montrose (7-2) 44.000
REGION 3
DISTRICT 1
Brooklyn Columbia Central (6-3) 36.000 at Jackson Lumen Christi (7-2) 58.222
Napoleon (8-1) 41.444 at Buchanan (7-2) 41.556
DISTRICT 2
Adrian Madison (6-3) 37.444 at Belding (7-2) 49.889
Kent City (7-2) 37.778 at Olivet (6-3) 45.778
REGION 4
DISTRICT 1
Dearborn Heights Robichaud (5-4) 34.333 at Detroit Edison (8-1) 52.778
Clawson (6-3) 43.444 at Clinton (8-1) 49.667
DISTRICT 2
Detroit Communication Media Arts (5-4) 36.333 at Ecorse (8-1) 52.333
Warren Michigan Collegiate (5-4) 39.222 at Detroit Central (8-1) 49.778
DIVISION 7
REGION 1
DISTRICT 1
Lakeview (5-4) 28.222 at Menominee (8-1) 52.778
Manton (7-2) 32.889 at Manistee (4-5) 36.889
DISTRICT 2
Oscoda (6-3) 31.222 at Charlevoix (6-2) 41.361
Harrison (7-2) 32.708 at McBain (7-2) 39.472
REGION 2
DISTRICT 1
Cass City (6-3) 31.778 at Pewamo-Westphalia (8-0) 43.264
Elkton-Pigeon-Bay Port Laker (7-2) 39.556 at Burton Bendle (9-0) 40.111
DISTRICT 2
Clinton Township Clintondale (3-6) 32.444 at Millington (9-0) 42.889
Saginaw Valley Lutheran (6-3) 33.444 at Ithaca (8-1) 40.778
REGION 3
DISTRICT 1
Saranac (7-2) 31.083 at Constantine (8-1) 46.169
Cassopolis (8-1) 37.000 at Ravenna (7-2) 42.222
DISTRICT 2
Galesburg-Augusta (7-2) 33.000 at Schoolcraft (7-2) 44.905
Lawton (5-4) 33.058 at North Muskegon (8-1) 43.625
REGION 4
DISTRICT 1
Leslie (4-5) 30.778 at Monroe St. Mary Catholic Central (8-1) 54.778
Bronson (7-2) 34.778 at Ottawa Lake Whiteford (7-2) 35.292
DISTRICT 2
Jonesville (5-4) 31.444 at Hanover-Horton (7-2) 41.222
Union City (7-2) 32.333 at Detroit Community (8-1) 37.444
DIVISION 8
REGION 1
DISTRICT 1
Beaverton (4-4) 24.458 at Beal City (9-0) 44.778
East Jordan (7-2) 34.764 at Iron Mountain (7-2) 35.778
DISTRICT 2
L'Anse (4-5) 25.222 at Bark River-Harris (7-2) 37.958
Frankfort (5-4) 28.889 at Maple City Glen Lake (7-2) 36.333
REGION 2
DISTRICT 1
Vestaburg (6-3) 26.778 at New Lothrop (8-1) 46.000
Saginaw Michigan Lutheran Seminary (6-3) 31.736 at Mount Pleasant Sacred Heart (6-3) 32.319
DISTRICT 2
Vassar (5-4) 27.222 at Ubly (6-3) 33.444
Saginaw Nouvel Catholic Central (5-4) 29.889 at Unionville-Sebewaing (7-2) 32.889
REGION 3
DISTRICT 1
Sand Creek (5-4) 26.444 at Hudson (8-1) 49.556
Fowler (6-3) 33.750 at Manchester (7-2) 34.333
DISTRICT 2
Vermontville Maple Valley (5-4) 27.333 at Decatur (9-0) 47.000
Saugatuck (6-3) 32.222 at Springport (8-1) 37.444
REGION 4
DISTRICT 1
Sterling Heights Parkway Christian (5-4) 24.333 at Madison Heights Madison (7-2) 45.111
Burton Atherton (6-3) 30.111 at Southfield Bradford Academy (6-3) 33.444
DISTRICT 2
Marine City Cardinal Mooney (6-3) 25.889 at Royal Oak Shrine Catholic (8-1) 39.778
Allen Park Cabrini (5-4) 26.889 at Clarkston Everest Collegiate (8-1) 39.111
8-Player Pairings
DIVISION 1
REGION 1
Mio (6-3) 31.619 at Pickford (7-2) 36.736
Ishpeming (7-2) 32.111 at Rudyard (7-2) 33.569
REGION 2
Kingston (5-4) 30.639 at Dryden (9-0) 38.750
Marlette (7-2) 31.111 at Deckerville (8-1) 33.639
REGION 3
Concord (6-3) 30.125 at Climax-Scotts (7-2) 35.236
Bridgman (8-1) 33.306 at Colon (8-1) 33.681
REGION 4
Fulton (6-3) 31.952 at Merrill (8-1) 36.556
Blanchard Montabella (8-1) 33.889 at Dansville (7-2) 35.111
DIVISION 2
REGION 1
Powers North Central (7-2) 32.444 at Lake Linden-Hubbell (9-0) 38.000
St. Ignace (8-1) 35.556 at Gaylord St. Mary (9-0) 35.833
REGION 2
Onekama (6-3) 29.333 at Portland St. Patrick (9-0) 38.333
Grand Rapids Sacred Heart (8-1) 32.889 at Marion (9-0) 35.333
REGION 3
Adrian Lenawee Christian (4-5) 27.778 at Mendon (9-0) 40.458
Marcellus (6-3) 29.750 at Litchfield (8-1) 31.681
REGION 4
Peck (6-3) 27.845 at Bay City All Saints (8-1) 34.984
Britton Deerfield (7-2) 30.778 at Kinde North Huron (7-2) 31.861
The MHSAA is a private, not-for-profit corporation of voluntary membership by more than 1,500 public and private senior high schools and junior high/middle schools which exists to develop common rules for athletic eligibility and competition. No government funds or tax dollars support the MHSAA, which was the first such association nationally to not accept membership dues or tournament entry fees from schools. Member schools which enforce these rules are permitted to participate in MHSAA tournaments, which attract more than 1.4 million spectators each year.
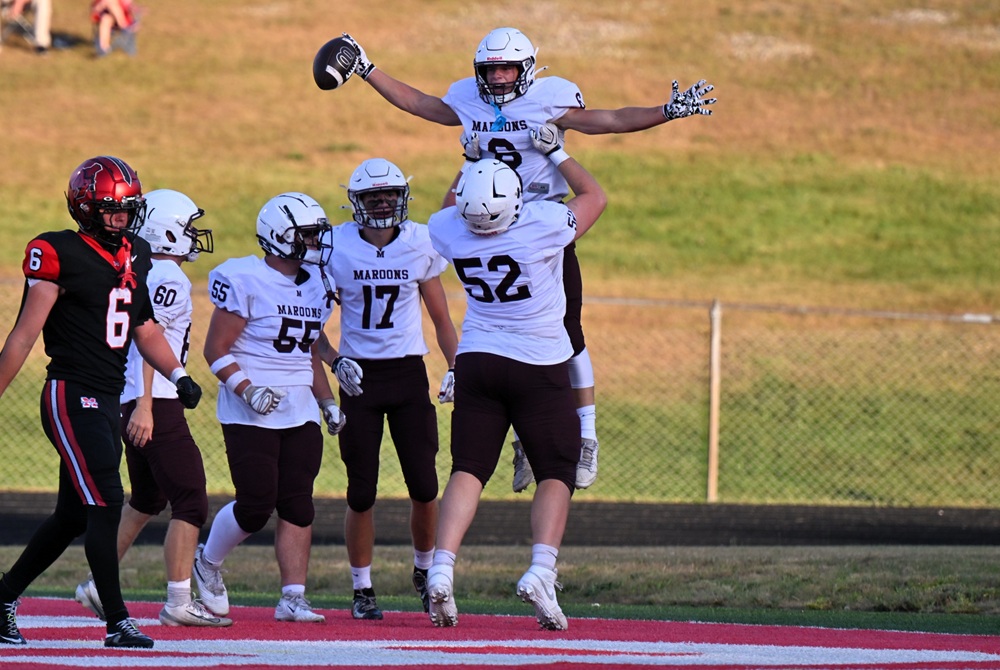
PHOTO Menominee's Kahne Clarke (52) lifts Jackson Myszak (6) after Myszak runs for the first touchdown of the game during a Sept. 3 win at Marquette. (Photo by Cara Kamps.)