

Pay-to-Play Use Hovers at 50 percent
By
Geoff Kimmerly
MHSAA.com senior editor
July 30, 2019
By Geoff Kimmerly
Second Half editor
Half of MHSAA member high schools continued to assess sports participation fees during the 2018-19 school year, according to a survey that has measured the prevalence of charging students to help fund interscholastic athletics annually over the last 15 years.
Of the 604 schools which responded to the 2018-19 survey, exactly half – 302 – assessed a participation fee, while 302 did not during the past school year. This year’s survey results are in line with those of the last two schools years, which saw 49.7 percent of schools charging participation fees for 2016-17 and 49 percent in 2017-18. For the purposes of the survey, a participation fee was anything $20 or more regardless of what the school called the charge (registration fee, insurance fee, transportation fee, etc.).
The MHSAA conducted its first participation fee survey during the 2003-04 school year, when 24 percent of responding schools reported they charged fees. The percentage of member schools charging fees crossed 50 percent in 2010-11 and reached a high of 56.6 percent in 2013-14 before falling back below 50 percent in 2016-17.
A record number of member high schools responded to the survey for the second straight year – 81 percent of the MHSAA’s 750 member schools provided data for 2018-19. Class A schools again remained the largest group charging fees, with 69 percent of respondents doing so. Class B and Class C schools followed, both with 48 percent charging fees, and Class D schools also remained in line with the previous year with 35 percent charging for participation.
Charging a standardized fee for each team on which a student-athlete participates – regardless of the number of teams – remains the most popular method among schools assessing fees, with that rate at 45 percent of schools. Schools charging a one-time standardized fee per student-athlete remained constant at 28 percent. A slight uptick was seen in the percentage of schools assessing fees based on tiers of the number of sports a student-athlete plays (for example, charging a larger fee for the first team and less for additional sports), with 20 percent of responding schools charging in this way compared to 15 percent a year ago.
The amounts of most fees remained consistent or similar as well during 2018-19. The median annual maximum fee per student of $150 and the median annual maximum family fee of $300 both remained constant for at least the fifth straight year, while the median fee assessed by schools that charge student-athletes once per year held steady at $125 for the third straight school year. The median per-team fee increased slightly, $5, to $80 for 2018-19.
The survey for 2018-19 and surveys from previous years can be found on the MHSAA Website.
The MHSAA is a private, not-for-profit corporation of voluntary membership by more than 1,500 public and private senior high schools and junior high/middle schools which exists to develop common rules for athletic eligibility and competition. No government funds or tax dollars support the MHSAA, which was the first such association nationally to not accept membership dues or tournament entry fees from schools. Member schools which enforce these rules are permitted to participate in MHSAA tournaments, which attract more than 1.4 million spectators each year.
Honorees Examples of Excellence
By
Geoff Kimmerly
MHSAA.com senior editor
March 13, 2013
By Geoff Kimmerly
Second Half editor
Dave Hutton had stepped away from the hockey program he’d started at Grandville High School more than a decade before when he was asked to come back and save it from extinction.
The team had struggled with low student interest – not to mention decreasing skill – and was under consideration to be eliminated in 1991. So Hutton volunteered to start over again. Order returned, the team quickly became successful and never had a losing season under Hutton before he retired from the sport in 2002.
He’s the first to say he was just one person who assisted in reviving the program. But he also served as an example – a common role he and Jim Gilmore surely shared during careers that have earned them this year’s Michigan High School Athletic Association’s Charles E. Forsythe Award
“It’s been important to me to do it properly; that’s how basically I always looked at it,” Hutton said of being a high school coach. “I was trained well by a lot of mentors, and consequently I tried to do things first class.
“When it comes down to being a coach, you set an example for fellow coaches. But more importantly, you want the athletes and parents to have a positive reaction to what you do, be proud of the program they are part of.”
 The annual award is in its 36th year and is named after former MHSAA Executive Director Charles E. Forsythe, the Association's first full-time and longest-serving chief executive. Forsythe Award recipients are selected each year by the MHSAA Representative Council, based on an individual's outstanding contribution to the interscholastic athletics community. Hutton and Gilmore will receive their honors during quarter breaks of the MHSAA Class A Boys Basketball Final on March 23 at the Breslin Student Events Center in East Lansing. Gilmore will receive his award during the break between the first and second quarters, and Hutton will receive his during the break between the third and fourth quarters.
Gilmore and Hutton have made contributing to Michigan high school athletics their lives’ work over the last four decades. Gilmore served four school districts over a 37-year career before retiring in 2008. He coached and taught at his alma mater Grant High School before moving on and eventually serving as athletic director at Kalamazoo’s Barbour Hall Academy (while also assisting at Kalamazoo Hackett Catholic Central High School). He was the athletic director and coached at Morenci High School and then served as athletic director at Tecumseh High School. Gilmore was named to the Michigan High School Football Coaches Association Hall of Fame in 2004 and also served that school year as president of the Michigan Interscholastic Athletic Administrators Association.
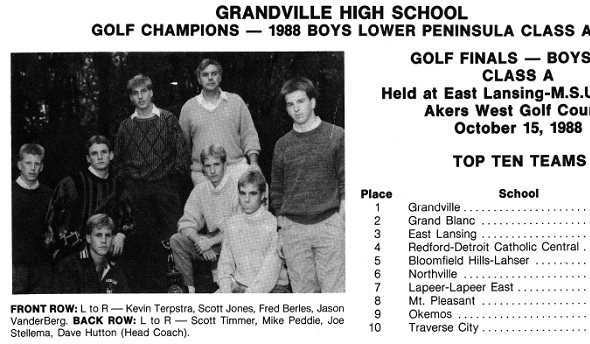
 Hutton, 64, has coached the Grandville High School boys golf team for 42 seasons and also started and led the ice hockey program for 18. His golf teams have posted a 520-180-9 dual meet record, made the MHSAA Finals 20 times and won Class A MHSAA championships in 1976 and 1988. His hockey teams over two stints as coach amassed a record of 212-189-23 with two Regional titles and a Division 1 Semifinal appearance in 2001, his second-to-last season coaching that sport.
“Jim Gilmore and Dave Hutton have made long-standing contributions to their respective sports and communities. Their dedication and high regard for school athletics are signified by their decades of work,” MHSAA Executive Director John E. “Jack” Roberts said. “Their continued efforts – Dave Hutton as a coach and MHSAA Finals director, and Jim Gilmore with the MIAAA – show that for both, this is a life-long commitment. We’re proud to honor Jim Gilmore and Dave Hutton with Forsythe Awards.”
 Gilmore, 65, coached football for 25 years at Grant, Barbour Hall and Morenci, and baseball for 15 seasons. He served on MHSAA site and officials selection committees for seven sports and as president of both the Tri-County Conference and Southeastern Conference. He was instrumental in renovations during his tenures at Morenci and Tecumseh and also wrote the athletic code book that established academic standards for Morenci athletes.
Gilmore also has volunteered in various capacities in his church and communities, and remains active in the MIAAA as part of the past presidents council and the awards and lifetime member committees.
“It’s something I wanted to do even when I was in high school,” said Gilmore, noting former Grant High principal, athletic director and football coach Ray Rynberg as a key mentor. “I was just watching what he did, and it was something I was really interested in as a kid. Participating in athletics, and then having the opportunity after finishing school to coach and be an athletic director, that was really something I enjoyed immensely.”
Hutton served as a member of the Michigan Golf Coaches Association Board for 24 years – and as president in 1984 and 1994 – and has directed a combined 18 boys and girls MHSAA Golf Finals. He was named Michigan golf Coach of the Year in 1977 by the National High School Athletic Coaches Association, Midwest Regional Coach of the Year in 1988 and the NHSACA’s national Coach of the Year in 2001. He also was recognized as the MIGCA Coach of the Year in 1976 and 1988 and as the Michigan High School Coaches Association Coach of the Year in 1977 and 1989. He was inducted into the MIGCA Hall of Fame in 1993 and the MHSCA Hall of Fame in 2002.
Hutton retired from the classroom in 2010 after teaching math and science at the elementary and middle school levels at Grandville for 41 years. He also has impacted his local golf community as a United State Golf Association junior tournament director and Professional Golf Association co-chairman of “Club for Kids” for Kent County.
“There’s still this satisfaction in seeing players in either sport be successful and continue to enjoy the sport when they’ve left (high school),” Hutton said. “There are times when kids say they’ve had enough of that. But it’s nice to see, just being a part of their growth in a sport as it continues beyond, whether they play in college or even as an adult in a rec league or church league, that they enjoyed it and learned something when you were their coach.”
Hutton received his bachelor’s degree from Grand Valley State University in 1967 and his master’s from Michigan State University in 1977. Gilmore received his bachelor’s degree from Western Michigan University in 1975 and followed with graduate studies both at WMU and Eastern Michigan University.
Past recipients of the Charles E. Forsythe Award:
1978 - Brick Fowler, Port Huron; Paul Smarks, Warren
1979 - Earl Messner, Reed City; Howard Beatty, Saginaw
1980 - Max Carey, Freesoil
1981 - Steven Sluka, Grand Haven; Samuel Madden, Detroit
1982 - Ernest Buckholz, Mt. Clemens; T. Arthur Treloar, Petoskey
1983 - Leroy Dues, Detroit; Richard Maher, Sturgis
1984 - William Hart, Marquette; Donald Stamats, Caro
1985 - John Cotton, Farmington; Robert James, Warren
1986 - William Robinson, Detroit; Irving Soderland, Norway
1987 - Jack Streidl, Plainwell; Wayne Hellenga, Decatur
1988 - Jack Johnson, Dearborn; Alan Williams, North Adams
1989 - Walter Bazylewicz, Berkley; Dennis Kiley, Jackson
1990 - Webster Morrison, Pickford; Herbert Quade, Benton Harbor
1991 - Clifford Buckmaster, Petoskey; Donald Domke, Northville
1992 - William Maskill, Kalamazoo; Thomas G. McShannock, Muskegon
1993 - Roy A. Allen Jr., Detroit; John Duncan, Cedarville
1994 - Kermit Ambrose, Royal Oak
1995 - Bob Perry, Lowell
1996 - Charles H. Jones, Royal Oak
1997 - Michael A. Foster, Richland; Robert G. Grimes, Battle Creek
1998 - Lofton C. Greene, River Rouge; Joseph J. Todey, Essexville
1999 - Bernie Larson, Battle Creek
2000 - Blake Hagman, Kalamazoo; Jerry Cvengros, Escanaba
2001 - Norm Johnson, Bangor; George Lovich, Canton
2002 - John Fundukian, Novi
2003 - Ken Semelsberger, Port Huron
2004 – Marco Marcet, Frankenmuth
2005 – Jim Feldkamp, Troy
2006 – Dan McShannock, Midland; Dail Prucka, Monroe
2007 – Keith Eldred, Williamston; Tom Hickman, Spring Lake
2008 – Jamie Gent, Haslett; William Newkirk, Sanford-Meridian
2009 – Paul Ellinger, Cheboygan
2010 – Rudy Godefroidt, Hemlock; Mike Boyd, Waterford
2011 – Eric C. Federico, Trenton
2012 – Bill Mick, Midland
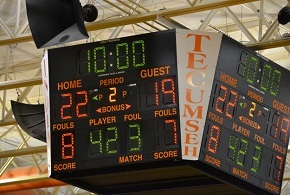
PHOTOS: (Top) Grandville boys golf coach Dave Hutton appeared with his 1988 team in the MHSAA's 1988-89 Book of Champions. (Below) The Tecumseh scoreboard hangs in the gymnasium Jim Gilmore once called home; he led renovation efforts during his tenure as athletic director. (Photo courtesy of Tecumseh High School.)